Email Productivity Metrics For Teams (2026 Guide)
Learn which email productivity metrics for teams actually matter. Complete measurement system covering flow, quality, and sustainability.

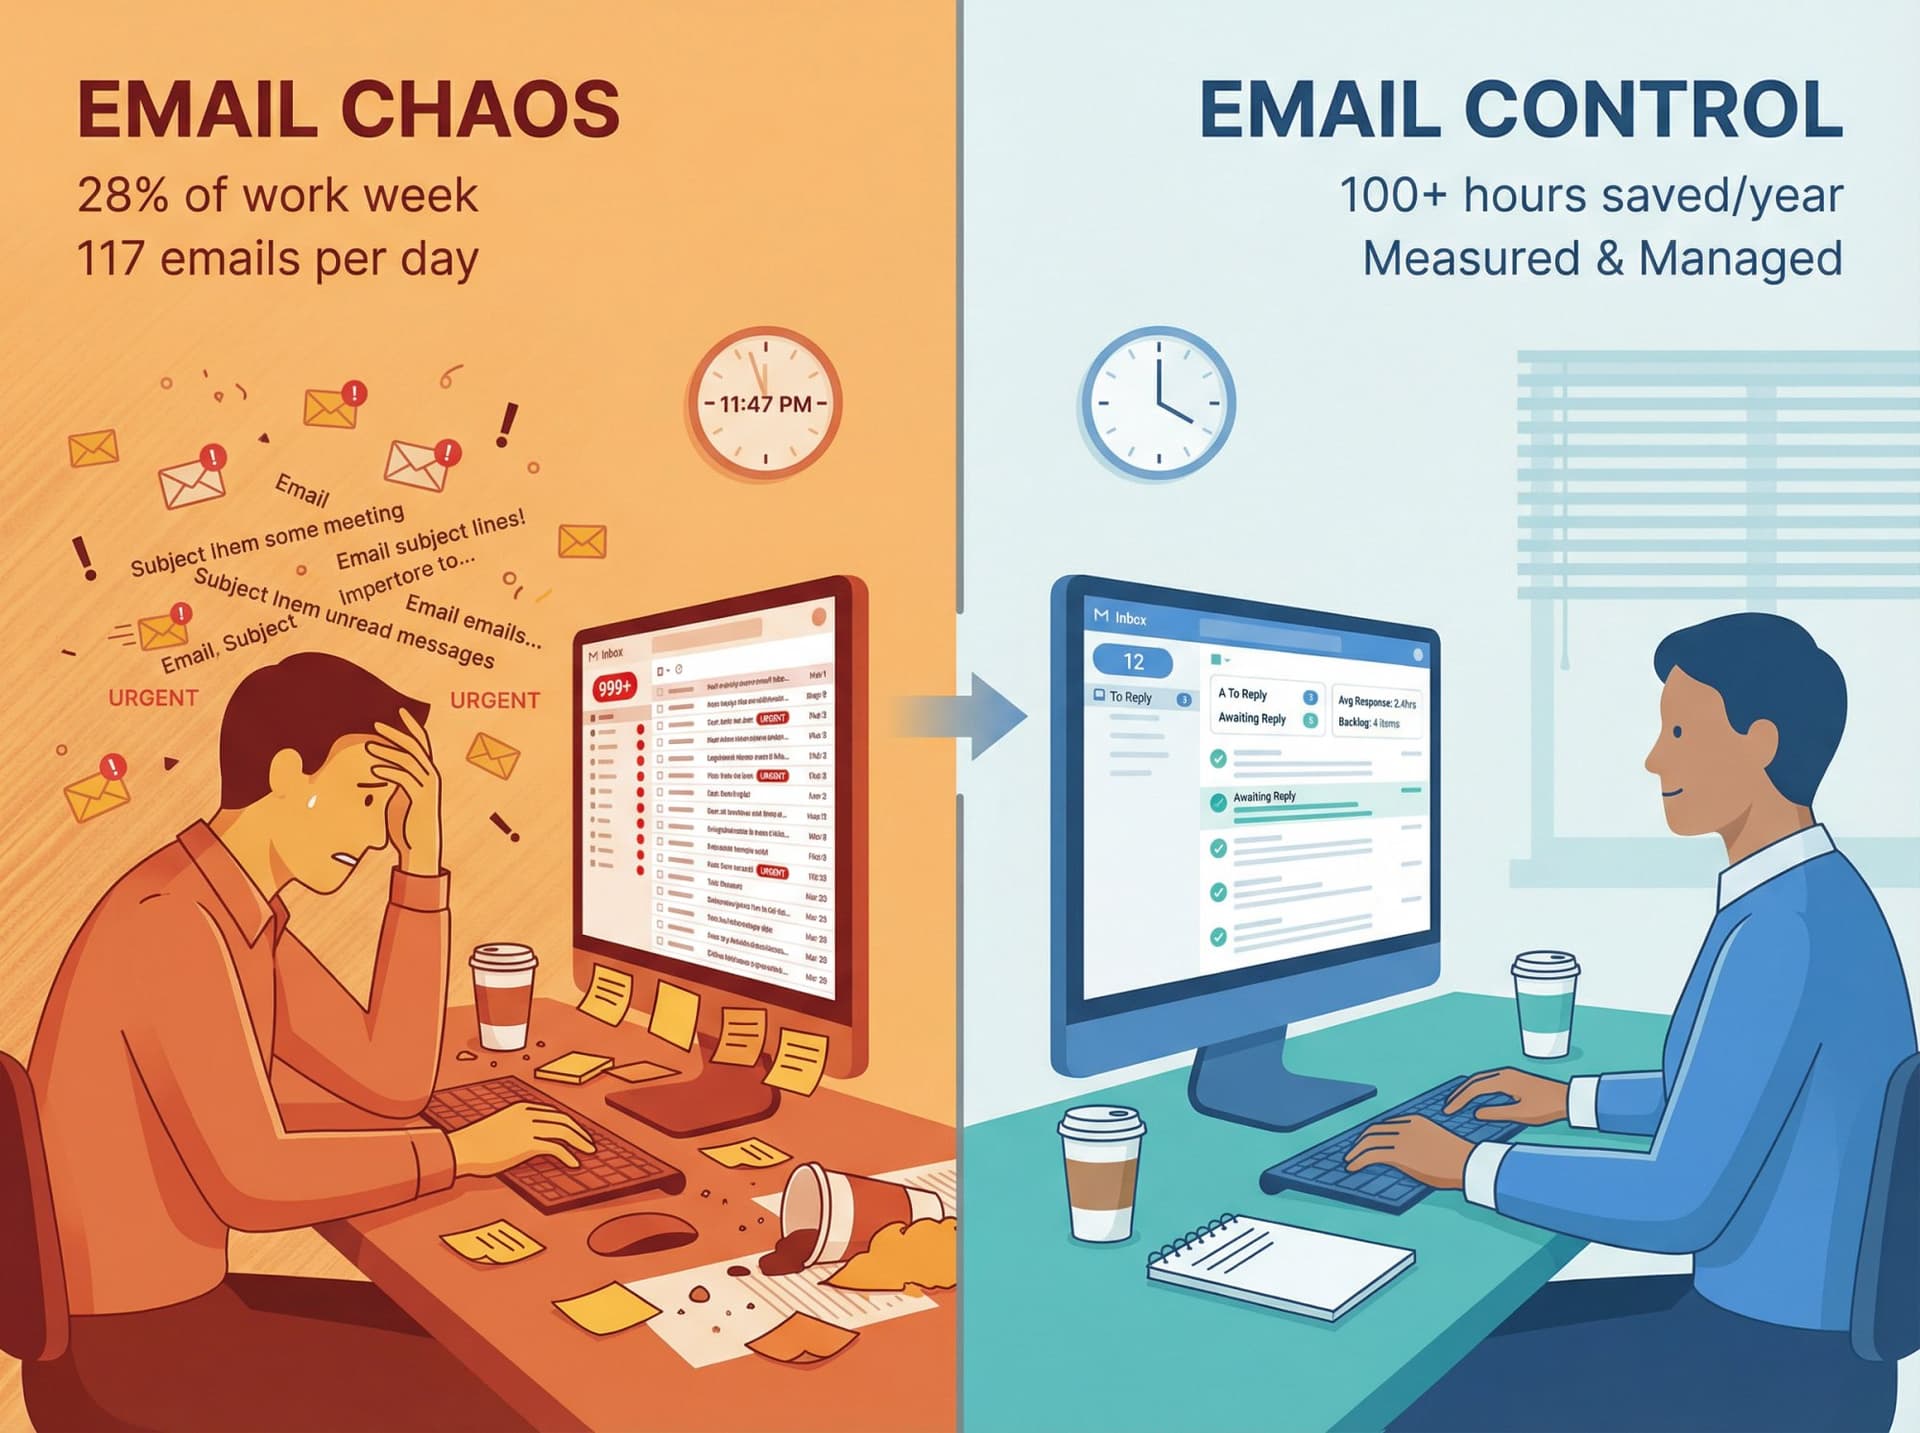
Your team spends 28% of their work week on email. That's more than two full workdays just reading and answering messages. The average knowledge worker gets 117 emails per day, and by 6 a.m., 40% of them are already checking their inbox.
Here's what most managers miss: you can't fix email overload until you measure it properly.
Most teams track the wrong things (emails sent, inbox counts) or nothing at all. They tell people to "be more responsive" without understanding why responses are slow. They try new tools without knowing if anything actually improved.
This guide gives you a complete measurement system for team email productivity. You'll learn which metrics actually matter, how to track them without creating a surveillance culture, and how to turn data into meaningful improvements that save hours every week.
Why Most Teams Measure Email Productivity Wrong
Walk into any team meeting and ask "how's email going?" You'll hear vague complaints: "too much email," "can't keep up," "important stuff gets buried."
But ask "what's your average first response time?" or "how many threads are stuck in your backlog?" and you'll get blank stares.
The problem isn't that teams don't care about email productivity. It's that they're measuring the wrong things or not measuring at all.
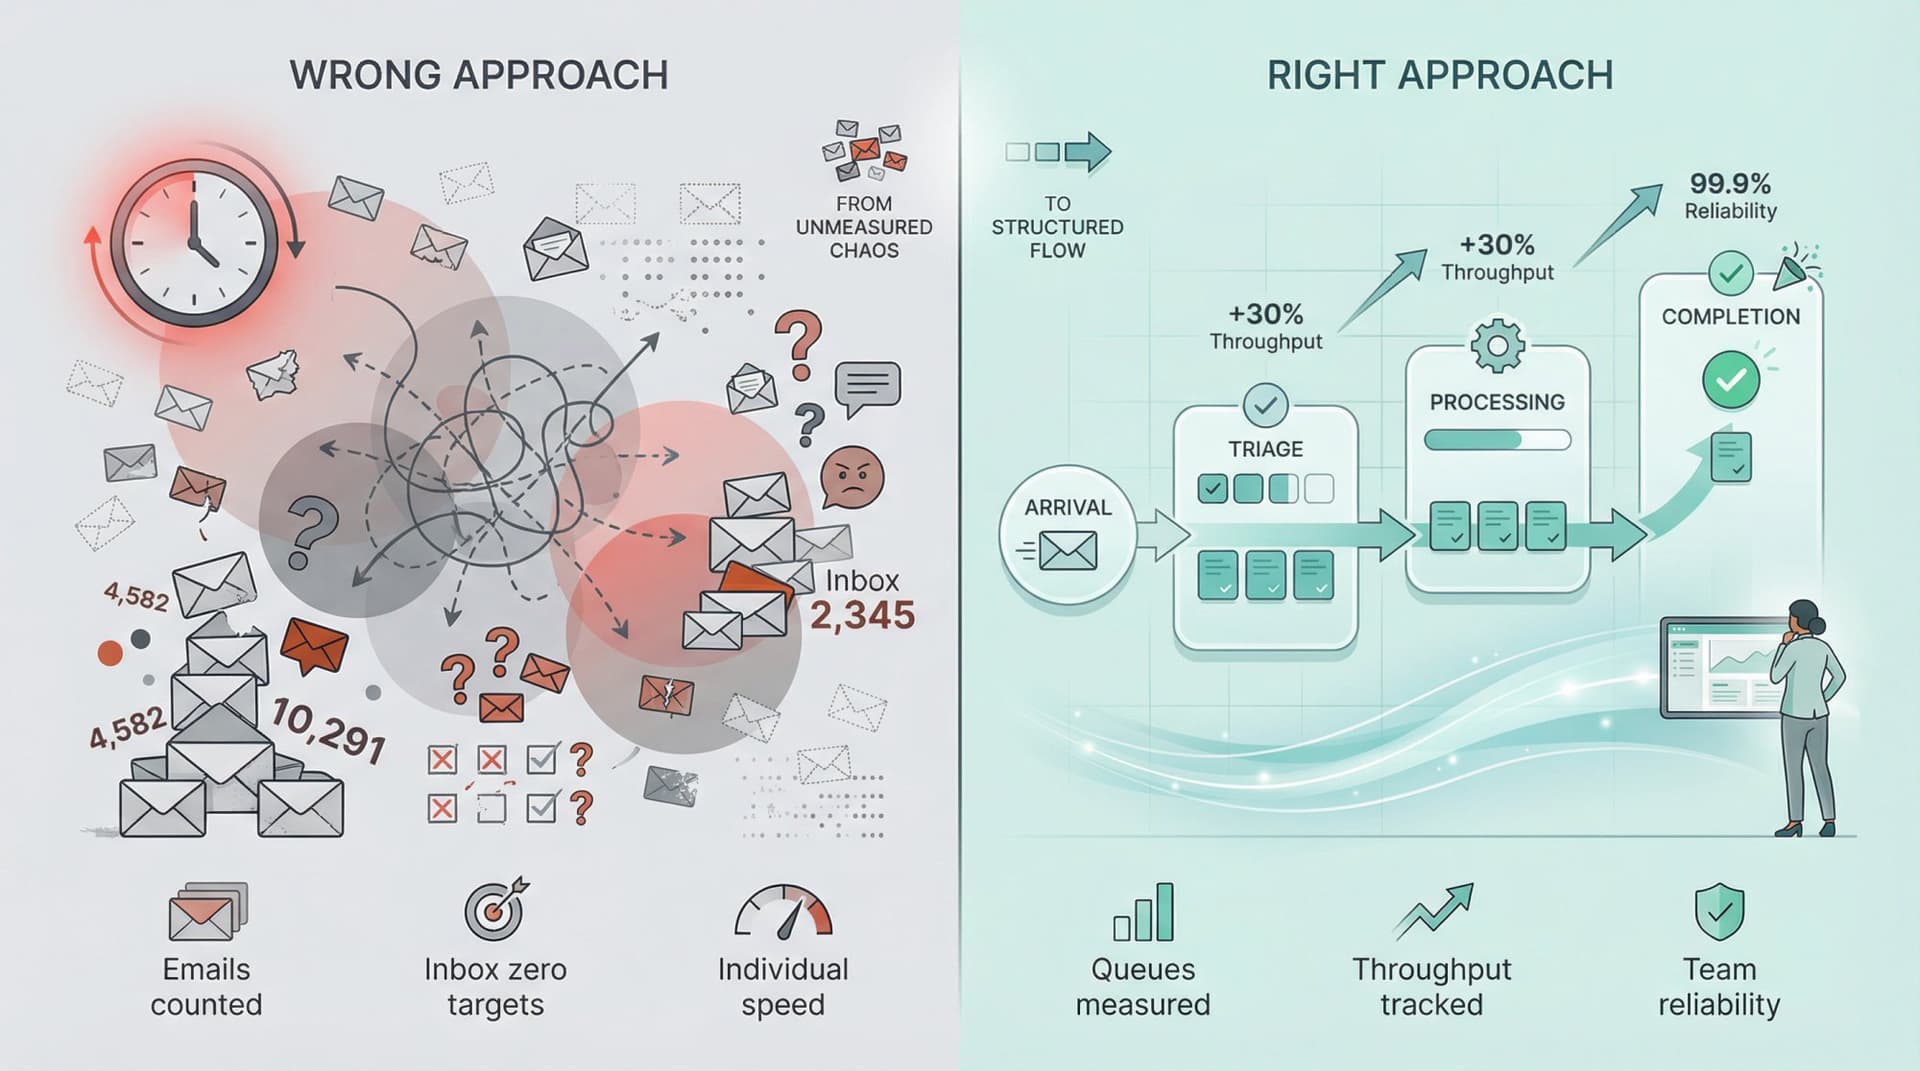
Common mistakes teams make:
Counting emails sent just encourages more email.
Tracking inbox zero rates punishes people for careful prioritization.
Focusing on individual speed instead of team reliability misses the point.
Ignoring business hours in calculations penalizes healthy boundaries.
These approaches create noise, stress, and perverse incentives while important messages still slip through the cracks. What teams actually need is a system that measures flow, reliability, and outcomes.
The Mental Model That Changes Everything
Stop thinking of email as a to-do list. Start thinking of it as a queue of work requests.
When you frame email this way, everything shifts:
→ Incoming messages are arrivals into a queue
→ Your team performs triage (categorize and route)
→ Someone takes action
→ The thread closes
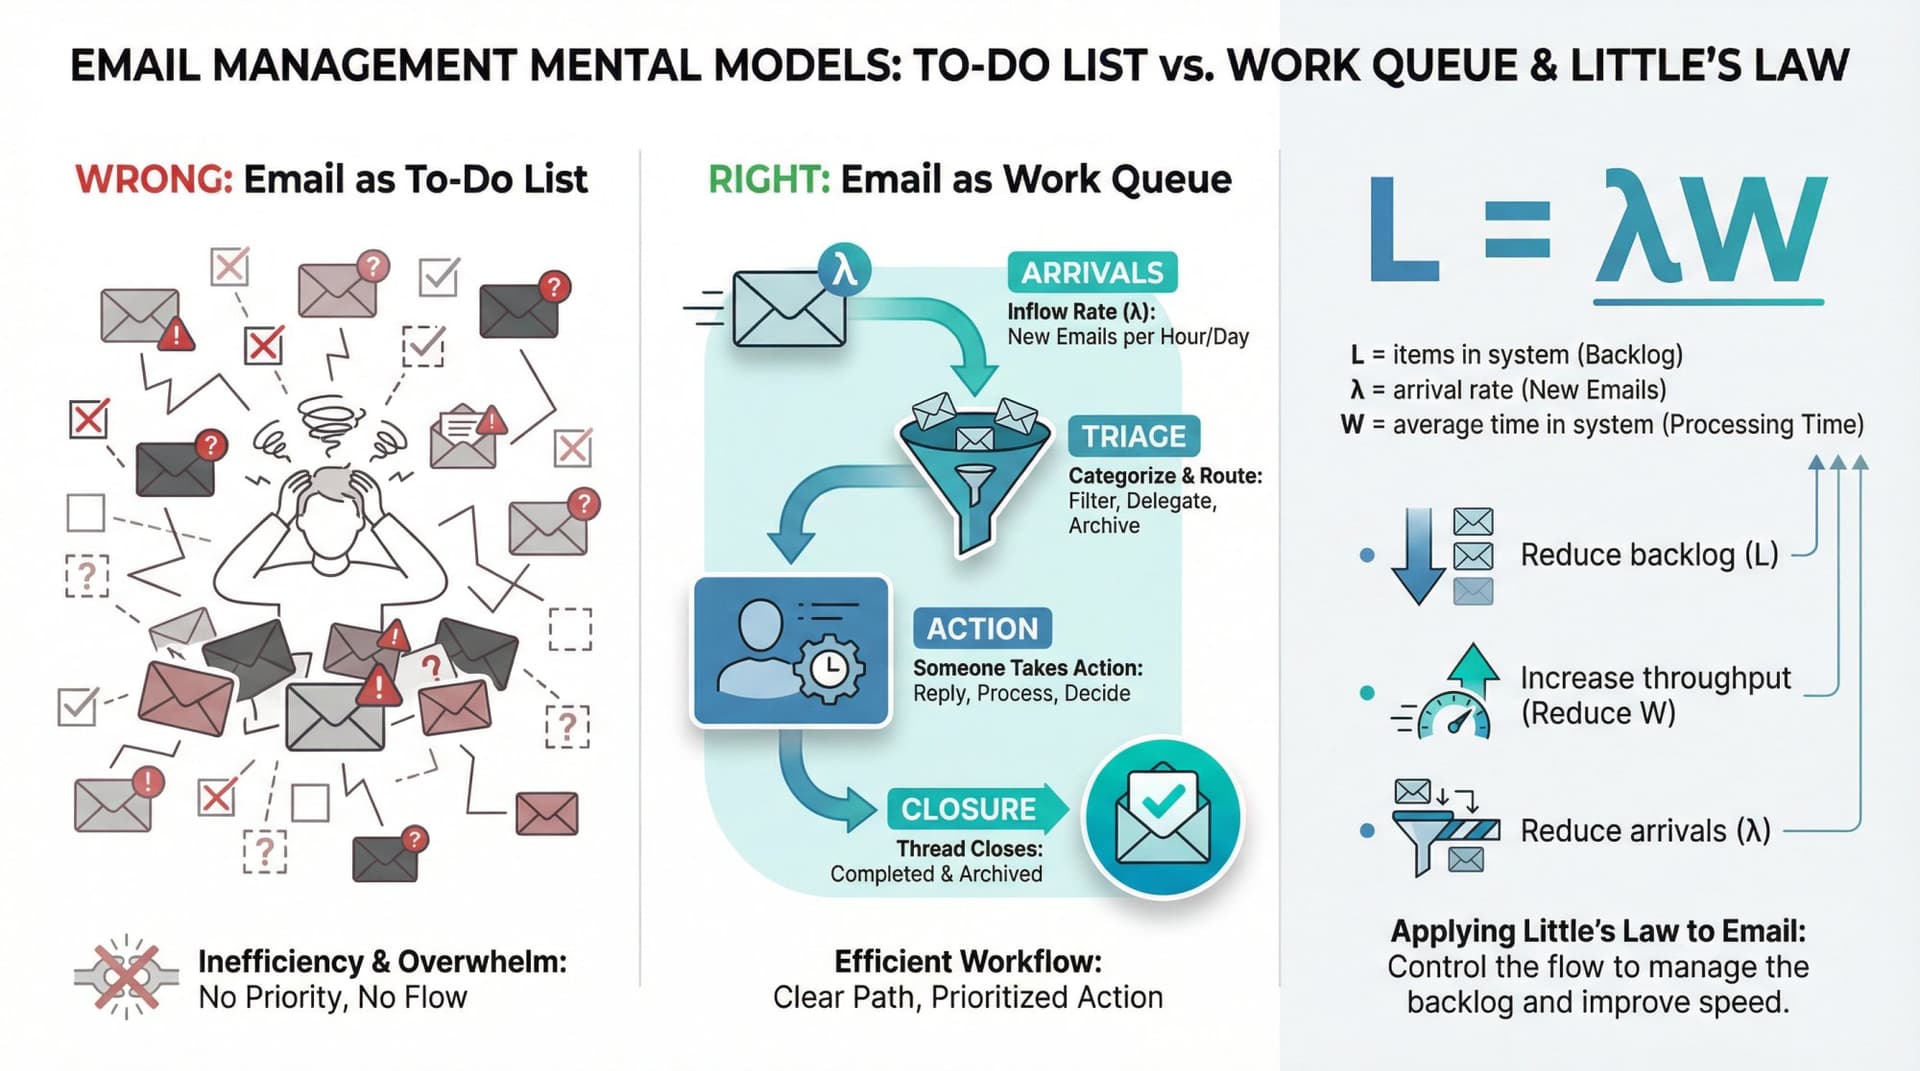
This mental model comes from queueing theory, which gives us Little's Law: the relationship between backlog, throughput, and time-in-system.
L = λW (items in system = arrival rate × average time in system)
In plain English: if you want faster responses, you must reduce backlog size, increase throughput, or reduce arrivals. You can't wish your way to better performance.
This changes what you measure. Instead of "how many emails did we send?" you ask "how fast do important threads move from arrival to first response to resolution?"
The Complete Email Productivity Metric Stack
Not all email stats matter equally. Here's a layered system that works for shared inboxes, customer-facing teams, and internal communication.
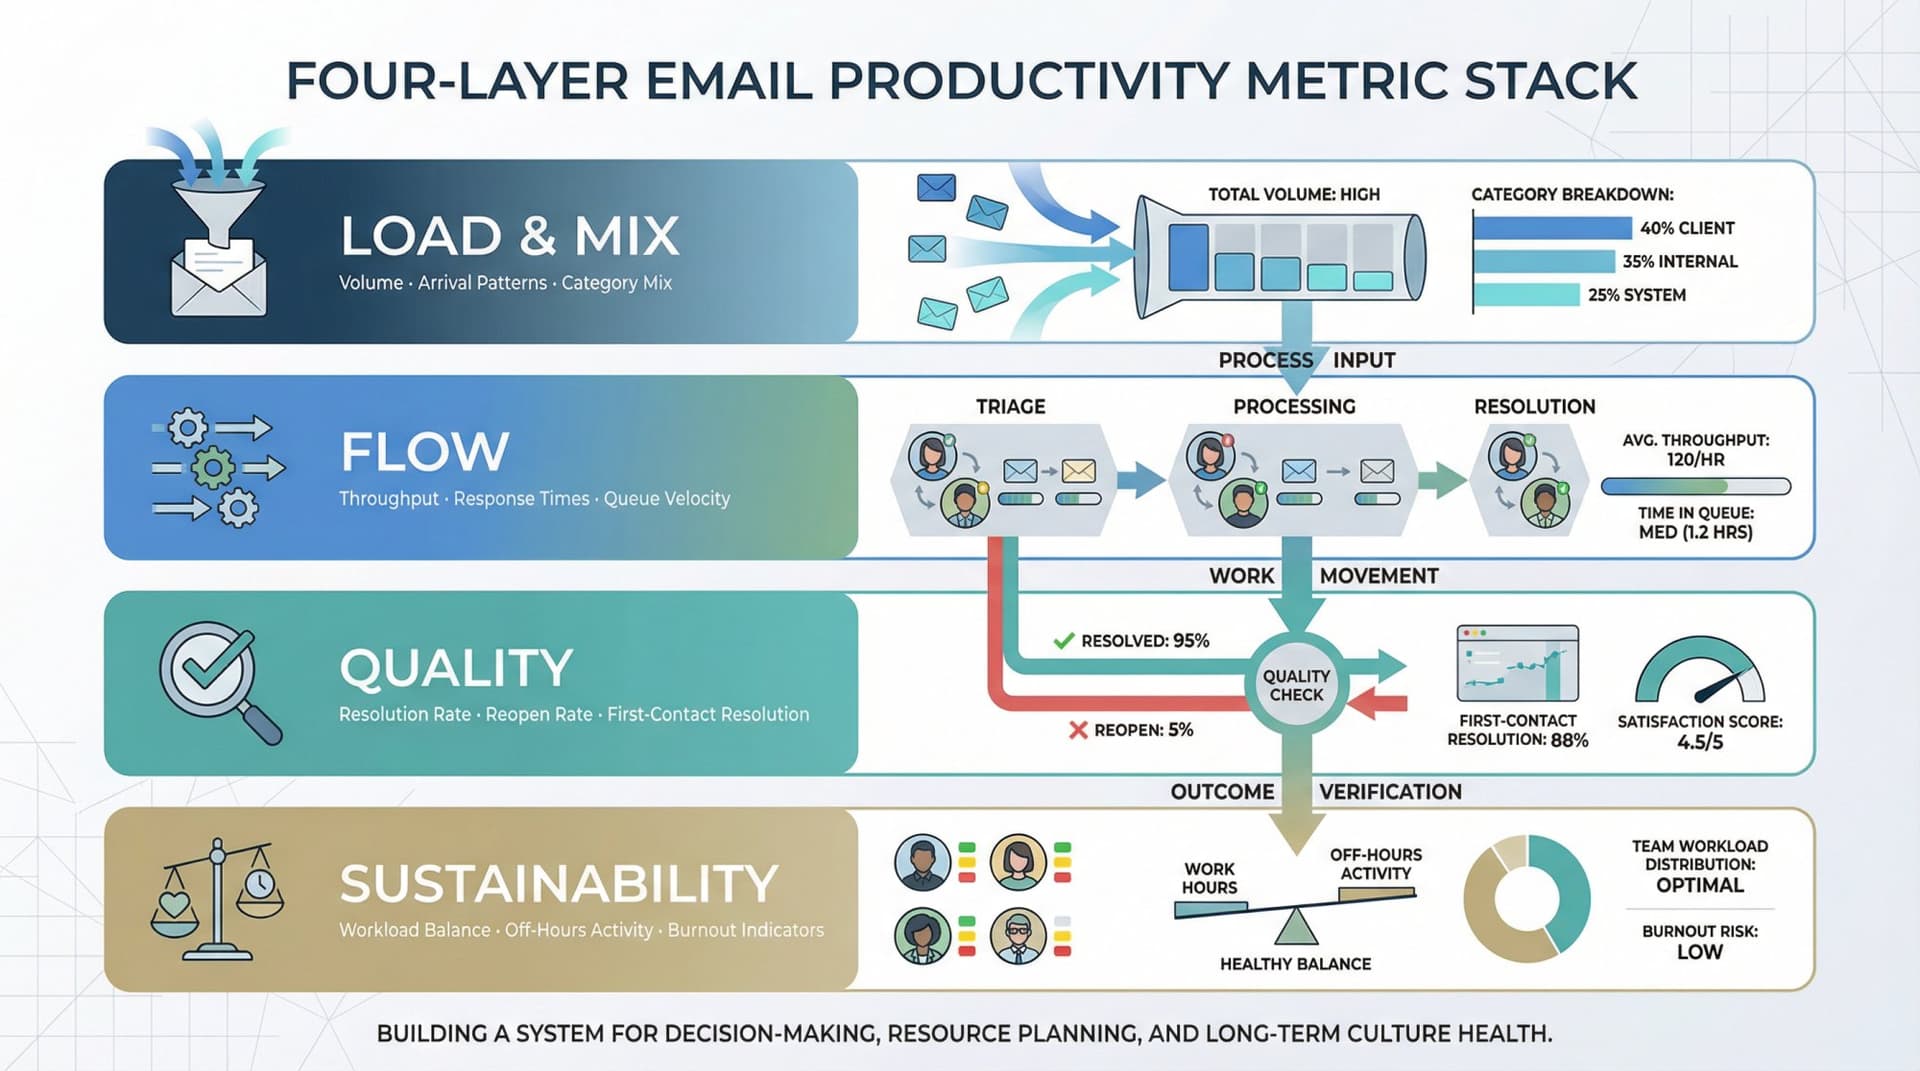
Layer 1: Load and Mix (What's Coming In)
These metrics tell you whether your team is being overloaded and by what type of work.
Inbound volume
Count new threads per day, not total messages. A 50-message chain about one topic is one work item, not 50.
Arrival patterns
Break volume down by hour and day. When does email rush hour happen? Research from Microsoft Work Trend Index shows that many knowledge workers already operate in high-interruption environments, making sustained focus difficult.
Category mix
What percentage comes from customers versus vendors versus internal teams versus newsletters? Understanding your mix helps you allocate resources and set different response expectations.
Top senders and domains
Who creates the most work? Sometimes one demanding client accounts for 30% of your volume, which tells you to consider dedicated support. Inbox Zero's email analytics helps identify these patterns automatically.
Why load metrics matter: Volume isn't performance, but volume explains performance. If arrivals spike and staffing doesn't, response times will degrade. You need to see it coming.
Layer 2: Flow (How Work Moves Through Your Team)
These are your highest-leverage metrics because they measure what stakeholders actually experience.
Time to triage
How long from arrival to "owned and categorized"? Most teams obsess over replying faster. Elite teams obsess over triage speed, because triage determines everything downstream.
Formula: timestamp(first assignment/label) - timestamp(inbound)
First response time (FRT)
How long until someone on your team sends the first reply?
Formula: timestamp(first outbound reply) - timestamp(first inbound message)
Track percentiles (p50, p90, p95), not just averages. A team with a 2-hour average FRT can still have angry escalations if 10% of emails wait two days.
Time to resolution
How long from arrival to "done"?
Formula: timestamp(closed) - timestamp(inbound)
This is what your customers and colleagues actually feel. "How long until my problem was solved?"
Backlog size and age
Count of open threads that still require action. Break it down by category (customer, vendor, internal) and track age distribution. What percentage are older than your SLA? What's the age of your oldest 10 threads?
Work-in-progress (WIP) per person
How many active threads does each team member have? Higher WIP correlates with longer response times (Little's Law again). Setting WIP limits can dramatically improve flow.
Handoffs
How many threads get forwarded or reassigned? Too many handoffs signal unclear ownership or poor initial routing.
Layer 3: Quality (Are You Solving the Problem?)
Speed without quality just creates more work later.
Reopen rate
Percentage of "resolved" threads that re-enter "needs action" within seven days. High reopen rates mean you're closing things prematurely or communicating unclearly.
Replies to resolve
How many back-and-forth messages does it take to close a thread? Excessive back-and-forth often signals that a phone call or shared document would have been faster.
Escalation rate
How often do threads need senior help? This helps identify training gaps or systemic issues.
Customer satisfaction (CSAT)
For customer-facing teams, track satisfaction scores on resolved conversations. Some helpdesk tools make this easy with post-resolution surveys.
Error rate
Wrong recipient, wrong attachment, wrong promise made. Track these to identify process improvements or training needs.
Layer 4: Cost and Sustainability (Are You Burning Out Your Team?)
Faster isn't always better. Your goal is reliable performance with healthy boundaries.
After-hours email activity
Volume sent outside normal working hours. Research shows that a significant percentage of employees check work email after hours, which correlates with higher stress and faster burnout.
Weekend email activity
Similar to after-hours. Some flexibility is fine, but if weekend email is the norm rather than the exception, you have a culture problem.
Time spent in email
If your analytics stack can capture it, track actual hours spent reading and writing email. The average is 28% of the work week, but your team might be higher.
| Metric Category | Primary Use | What It Reveals |
|---|---|---|
| Load and Mix | Resource planning | Whether you're overloaded and by what |
| Flow | Performance optimization | Where delays happen in your system |
| Quality | Process improvement | Whether you're actually solving problems |
| Sustainability | Culture health | Whether you're creating burnout |
The Metrics That Matter Most: A Complete Dictionary
Not every email stat deserves your attention. Here are the core metrics with clear definitions and formulas.
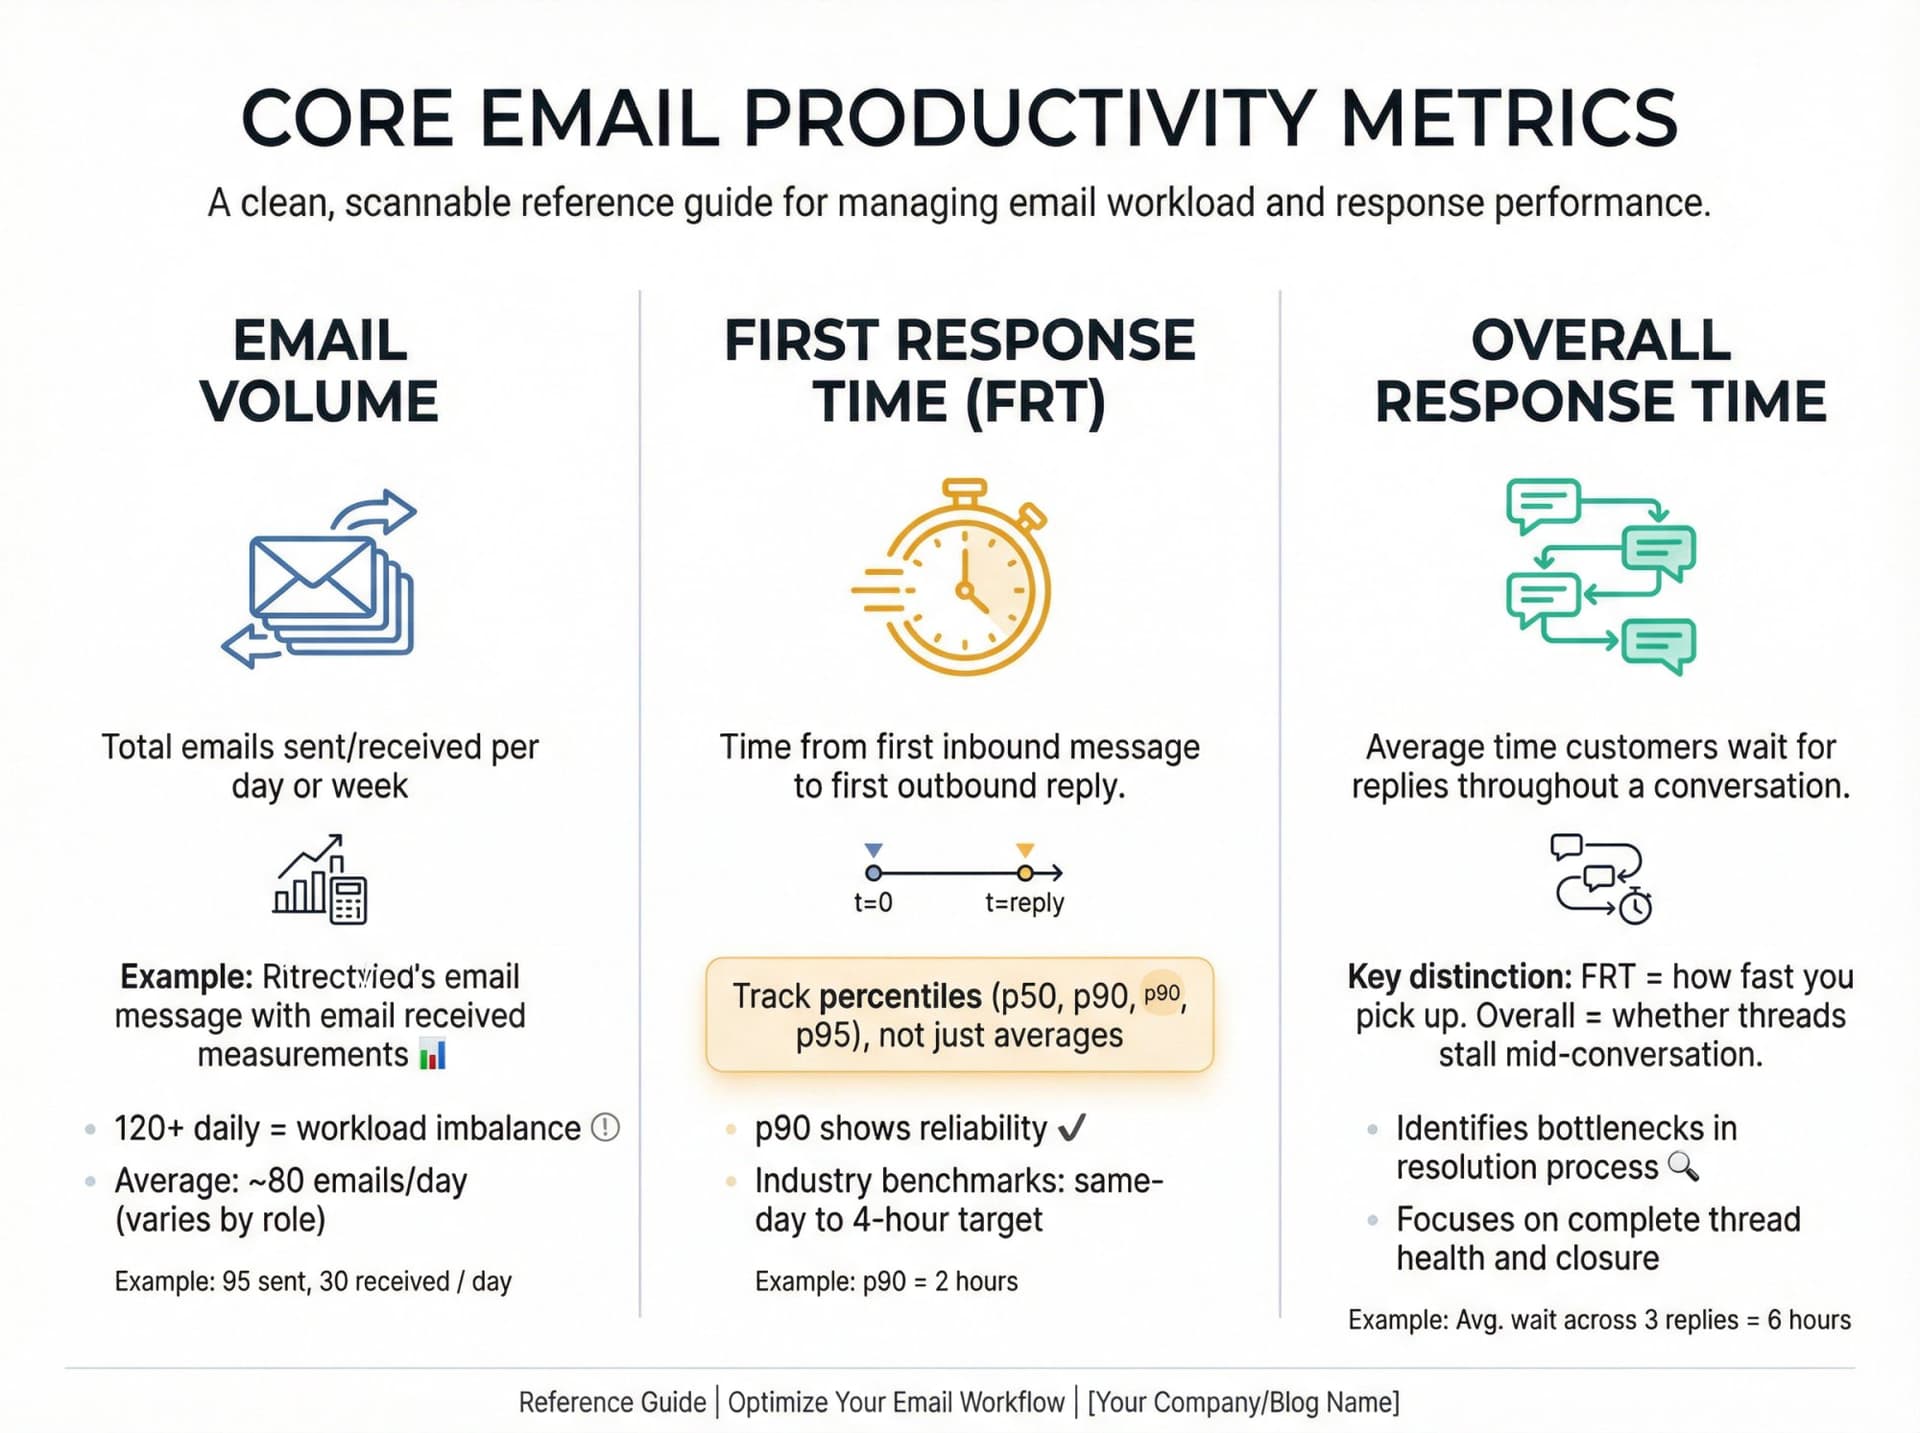
Email Volume (Sent and Received)
What to measure: Total emails each team member sends and receives per day or week.
For teams: Count new threads per day, not total messages. A 30-message chain is one conversation, not 30.
Why it matters: Volume is a basic workload barometer. If someone's handling 120+ emails daily while peers handle 40, you've got an imbalance to address. Research shows the average business user gets about 80 emails per day, but this varies wildly by role.
Volume also reveals trends. If team email spikes every Monday or drops in summer, you'll see it in the data and can plan accordingly.
Watch for: Significant deviations from your baseline. A sharp rise might precede burnout. A sharp drop might signal disengagement.
First Response Time (FRT)
What to measure: Time from first inbound message to first outbound reply.
Why it matters: Responsiveness is a key indicator of service quality and efficiency. Research shows being the first to respond to a lead can significantly increase your chances of winning business compared to slower replies.
Track percentiles, not just averages. Your p90 (90th percentile) response time shows what happens in rough cases. That's where reliability lives or dies.
Context matters: A slightly slower response might mean someone is prioritizing deep work over constant inbox checking, which isn't bad. But chronically slow responses (days when others reply in hours) signal a problem.
Industry benchmarks: Customer-facing teams often target same-day or within-four-hours responses. B2B sales teams might aim for under one hour during business hours. Use your industry norms as a guide, but tailor goals to your actual complexity and staffing.
Response Time (Overall)
What to measure: Average time customers wait for replies throughout a conversation, not just the first one.
Why it matters: First response time tells you how fast you pick up the phone. Overall response time tells you whether threads are stalling mid-conversation. Both matter for customer experience.
Time to Triage
What to measure: Time from inbound arrival to "owned and categorized."
Triage time = timestamp(first assignment/label) - timestamp(inbound)
Why it matters: Triage is the hidden bottleneck. If triage is slow, everything is slow. You can't respond quickly to something that sits unassigned for six hours.
Exceptional teams track this separately because it's the highest-leverage point in the email workflow. Inbox Zero's AI automation can automatically categorize and label incoming emails, dramatically reducing triage time.
Time to Resolution
What to measure: Time from arrival to completion.
Resolution time = timestamp(closed) - timestamp(inbound)
Why it matters: This is what stakeholders experience: "How long until my issue was solved?" Resolution time is your ultimate measure of team effectiveness.
Handle Time
What to measure: Active working time spent drafting and sending a reply. This is defined as time from opening a conversation to pressing Send.
Why it matters: Handle time separates "we're slow because we're overloaded" from "we're slow because drafting is hard." If handle time is low but resolution time is high, your bottleneck is workload or triage, not writing speed.
After-Hours Email Activity
What to measure: Volume of emails sent outside normal working hours (evenings, weekends).
Why it matters: High after-hours volume is a red flag for "always on" culture. It indicates pressure to check email 24/7, which leads to stress and burnout.
Use this metric to see if healthy boundary initiatives are working. If you try "no emails after 7 p.m." or encourage scheduled send, does after-hours volume actually drop?
Also useful for: Identifying who might be overworking. If one person sends 40% of all after-hours emails, they may need support or workload adjustment.
Backlog and Backlog Age
Backlog: Count of open threads requiring action.
Slice by:
→ Category (customer, vendor, internal)
→ Priority
→ Owner
Backlog age: Age distribution of open threads.
Track:
→ Percentage older than SLA
→ p90 age of open backlog
→ Oldest 10 threads (always)
Why it matters: Backlog metrics shine a light on follow-up discipline. Unanswered emails translate to lost opportunities, unhappy customers, or internal breakdowns. A rising backlog signals overload or disorganization.
Many teams use labels or tools to manage this. For example, Inbox Zero's Reply Zero feature automatically labels threads you need to respond to as "To Reply" and ones where you're waiting as "Awaiting Reply," making it easy to see your backlog at a glance.
Even without specialized tools, you can audit inboxes for messages past your SLA and prompt action: reply, delegate, or at minimum acknowledge receipt.
SLA Compliance
What to measure: Percentage of threads that met your service-level objective for a defined metric (usually FRT or resolution time).
Example: "95% of Priority 1 emails get a first response within 2 business hours."
Why it matters: SLAs create accountability and transparency. When your team has agreed-upon targets, you can measure progress and identify where processes are failing.
Reopen Rate
What to measure: Percentage of "resolved" threads that re-enter "needs action" within a defined window (typically 7 days).
Why it matters: Reopens are the tax you pay for low-quality closure or unclear communication. Exceptional teams track rework, not just closure counts.
If your reopen rate is high, dig into why: Are people closing threads prematurely? Is communication unclear? Do customers not understand the solution?
Top Senders and Recipients
What to measure: Who you exchange the most emails with, inside and outside your team.
Why it matters: This reveals your communication network and can identify key collaborators, information hubs, and potential silos.
You might discover one client accounts for a huge chunk of inbound volume (indicating a demanding account that needs dedicated support). Or internally, maybe Bob in Marketing receives 5× more emails from your team than anyone else. Is Bob a bottleneck or a central coordinator?
Watch for: Departments that should be collaborating but barely email each other. That's a silo worth bridging.
Email Traffic Patterns (By Time and Day)
What to measure: When emails flow most. Break down volume by hour of day and day of week.
Why it matters: Every team has an "email rush hour." Knowing when arrivals peak helps with scheduling and workload planning. If most emails hit between 4-6 p.m. daily, you might avoid scheduling meetings then or designate that time for inbox work.
Real example: One team discovered they were swamped with emails mid-morning every day, so they instituted "no internal emails 9-10 a.m." to create an uninterrupted focus block. Productivity improved with no loss in communication.
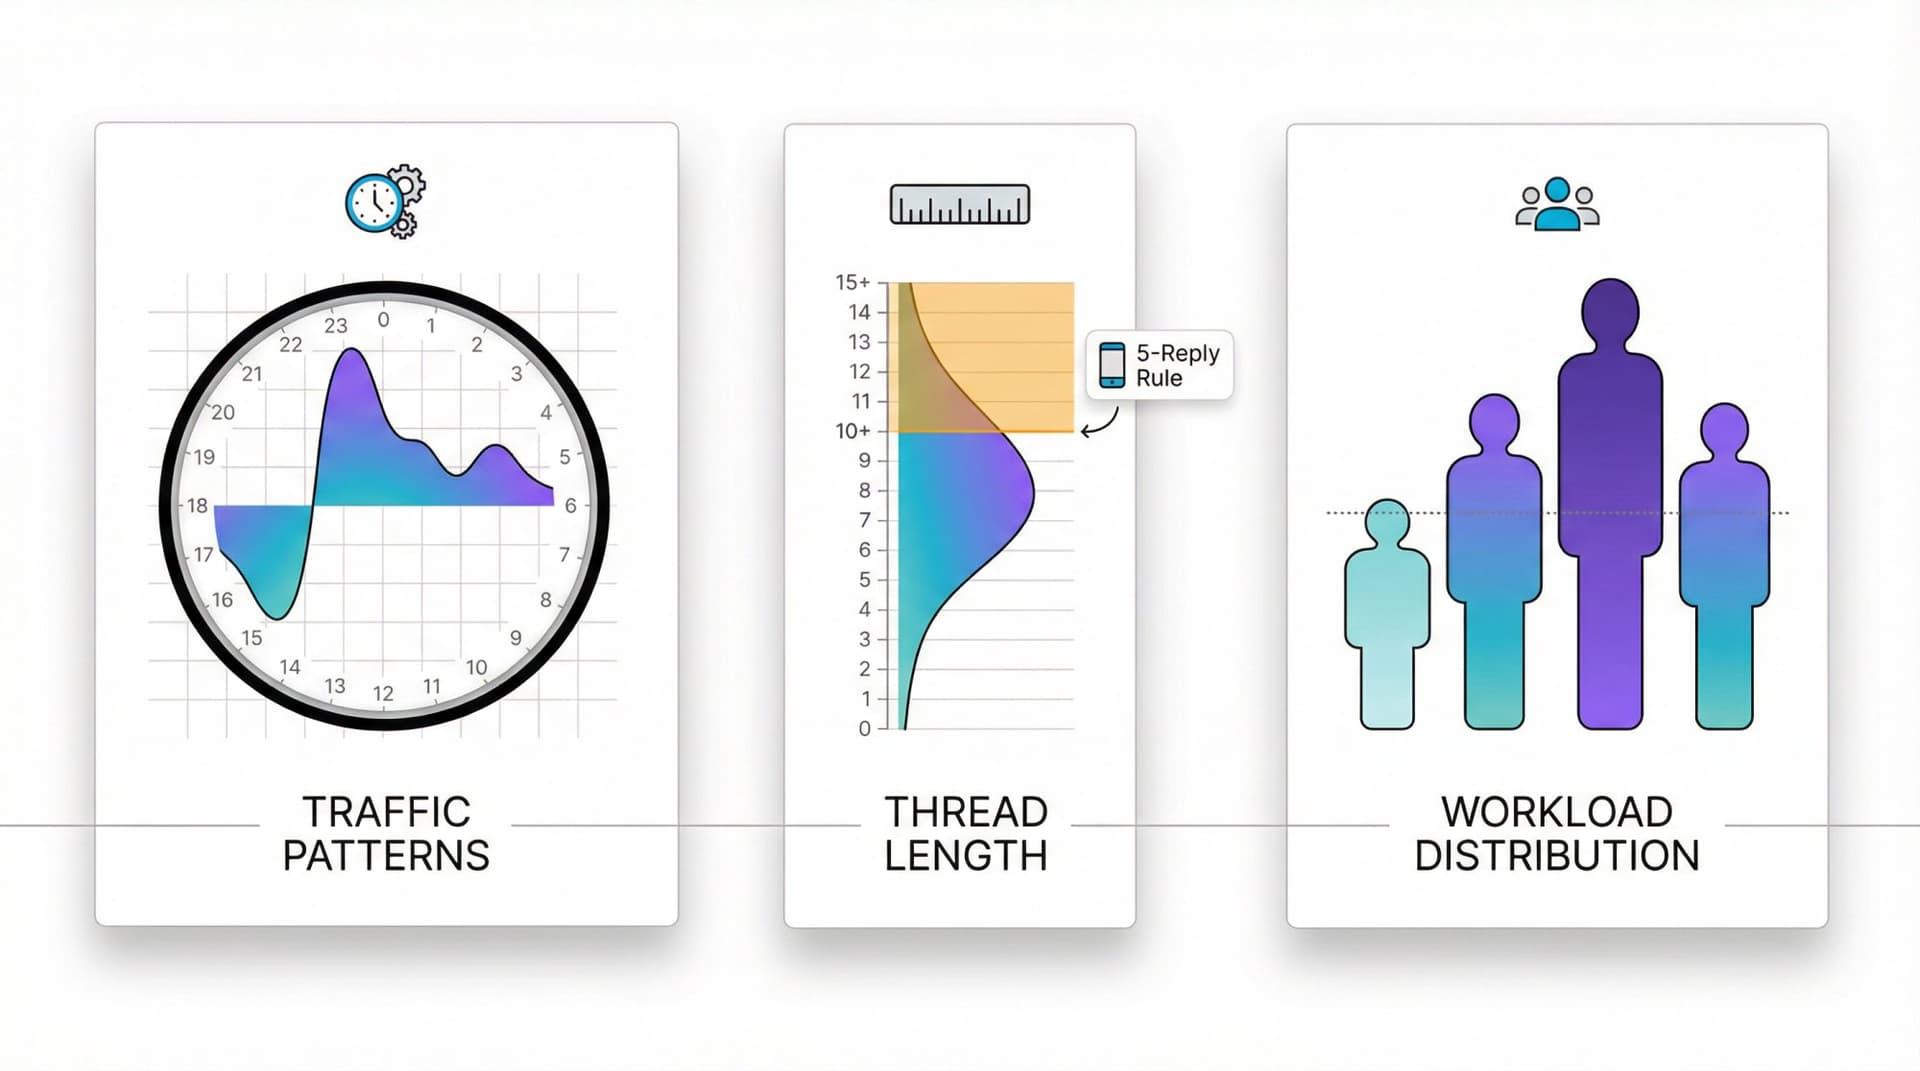
Average Email Thread Length
What to measure: Number of replies/forwards per thread. Calculate average or identify threads exceeding a threshold (10+ messages).
Why it matters: Long threads can indicate thorough collaboration, but often they signal inefficiency. If email threads routinely stretch into double-digit replies, the conversation would probably be faster via phone or shared document.
Practical tip: Try a "5-reply rule": if an email thread goes beyond five replies on the same day, jump on a quick call instead.
Workload Distribution
What to measure: How evenly work is distributed across team members.
Track:
→ Threads resolved per person
→ Percentage of total volume handled by top 1-2 people
→ Outliers (someone quietly drowning)
Why it matters: Prevents burnout and ensures fairness. If one person handles twice as much as peers, that's unsustainable.
Stop Using Averages as Your Primary Metric
Here's a truth most teams miss: averages hide pain.
Google's SRE guidance explains why percentiles matter more than averages. High-order percentiles (p90, p95, p99) show plausible worst-case experience, while p50 shows the typical case. Long-tail behavior becomes critical under load.
For email teams, the practical version is:
| Metric | What It Shows |
|---|---|
| p50 | "Typical" performance |
| p90/p95 | "Reliability" |
| max/oldest | Prevents disasters |
A team with a 2-hour average first response time can still have angry escalations if 10% of emails wait two days. The average looks fine. The experience for some customers is terrible.
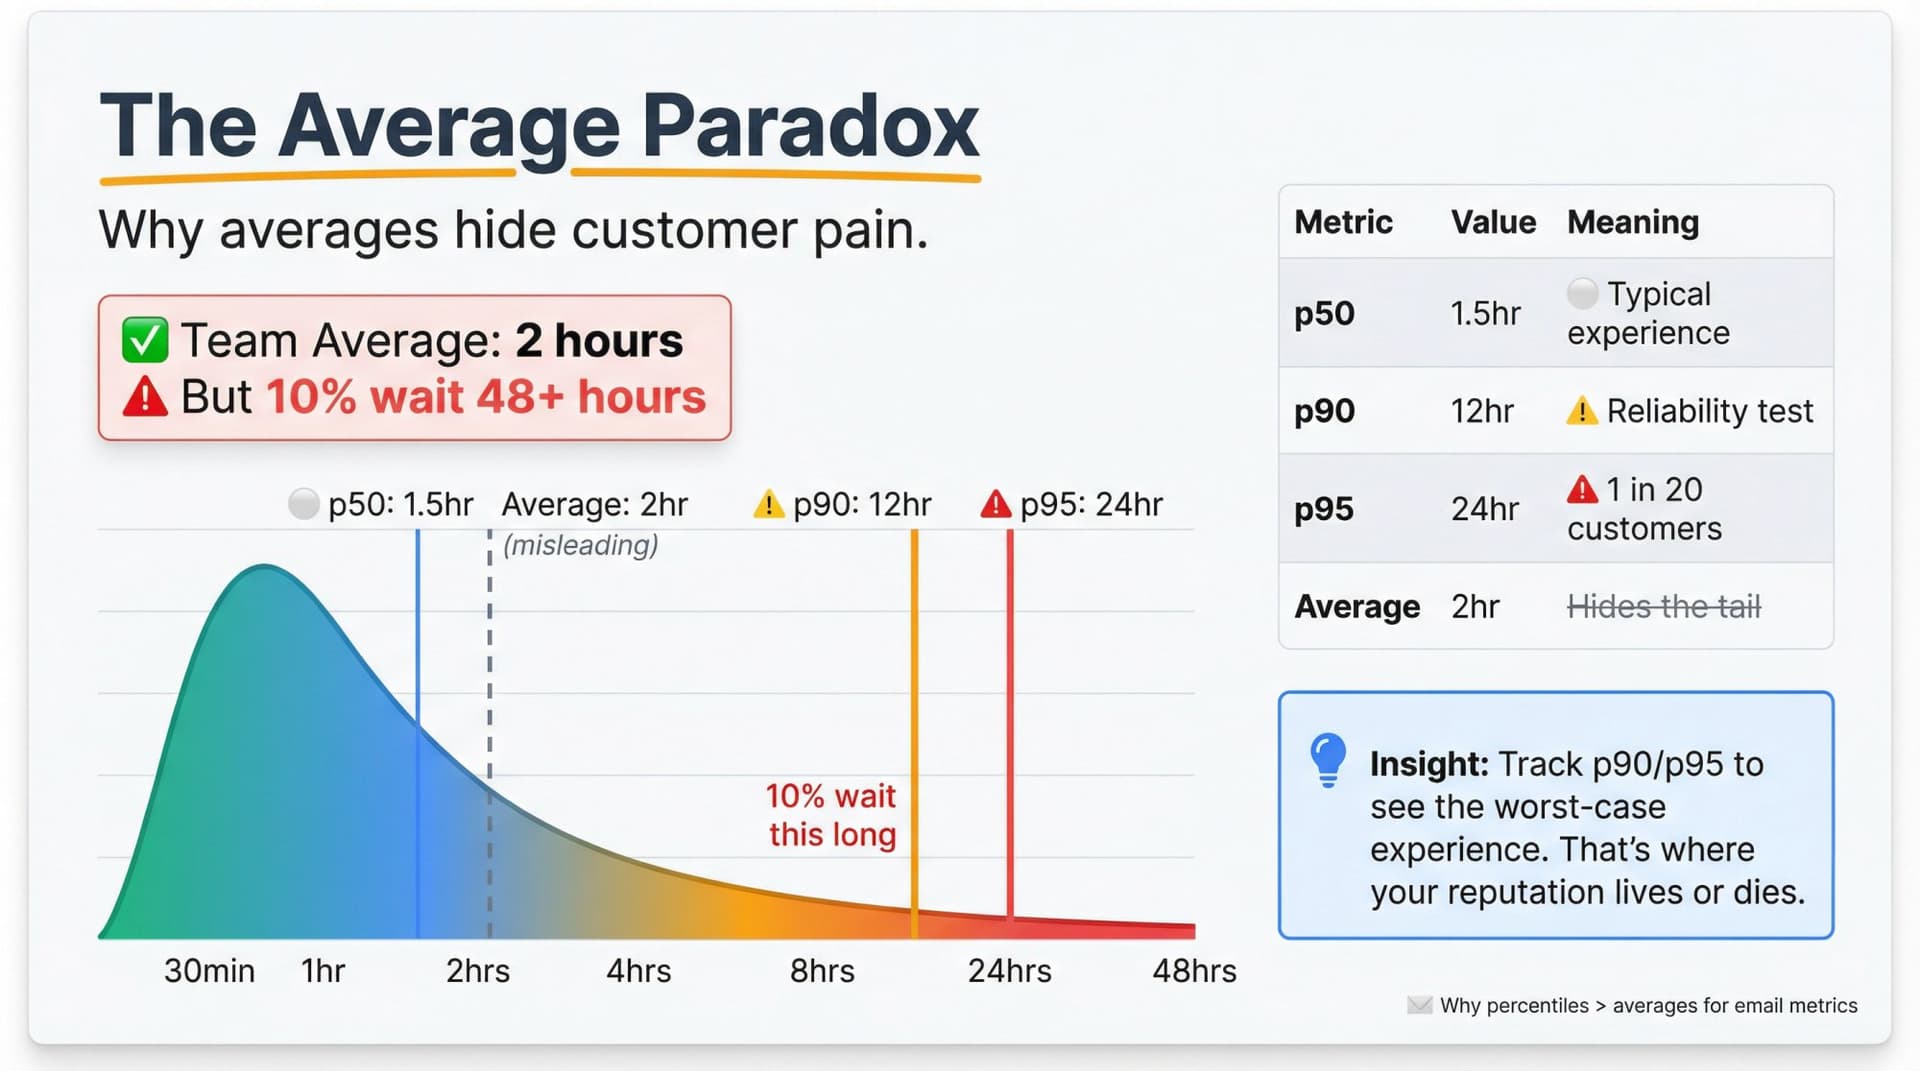
Always ask: "What's happening at the edges?" That's where your reputation lives or dies.
Building Your Team Dashboard
A weekly operating system for email performance.
You can set this up in a BI tool, spreadsheet, or analytics platform like Inbox Zero's email analytics. The key is consistency and visibility.
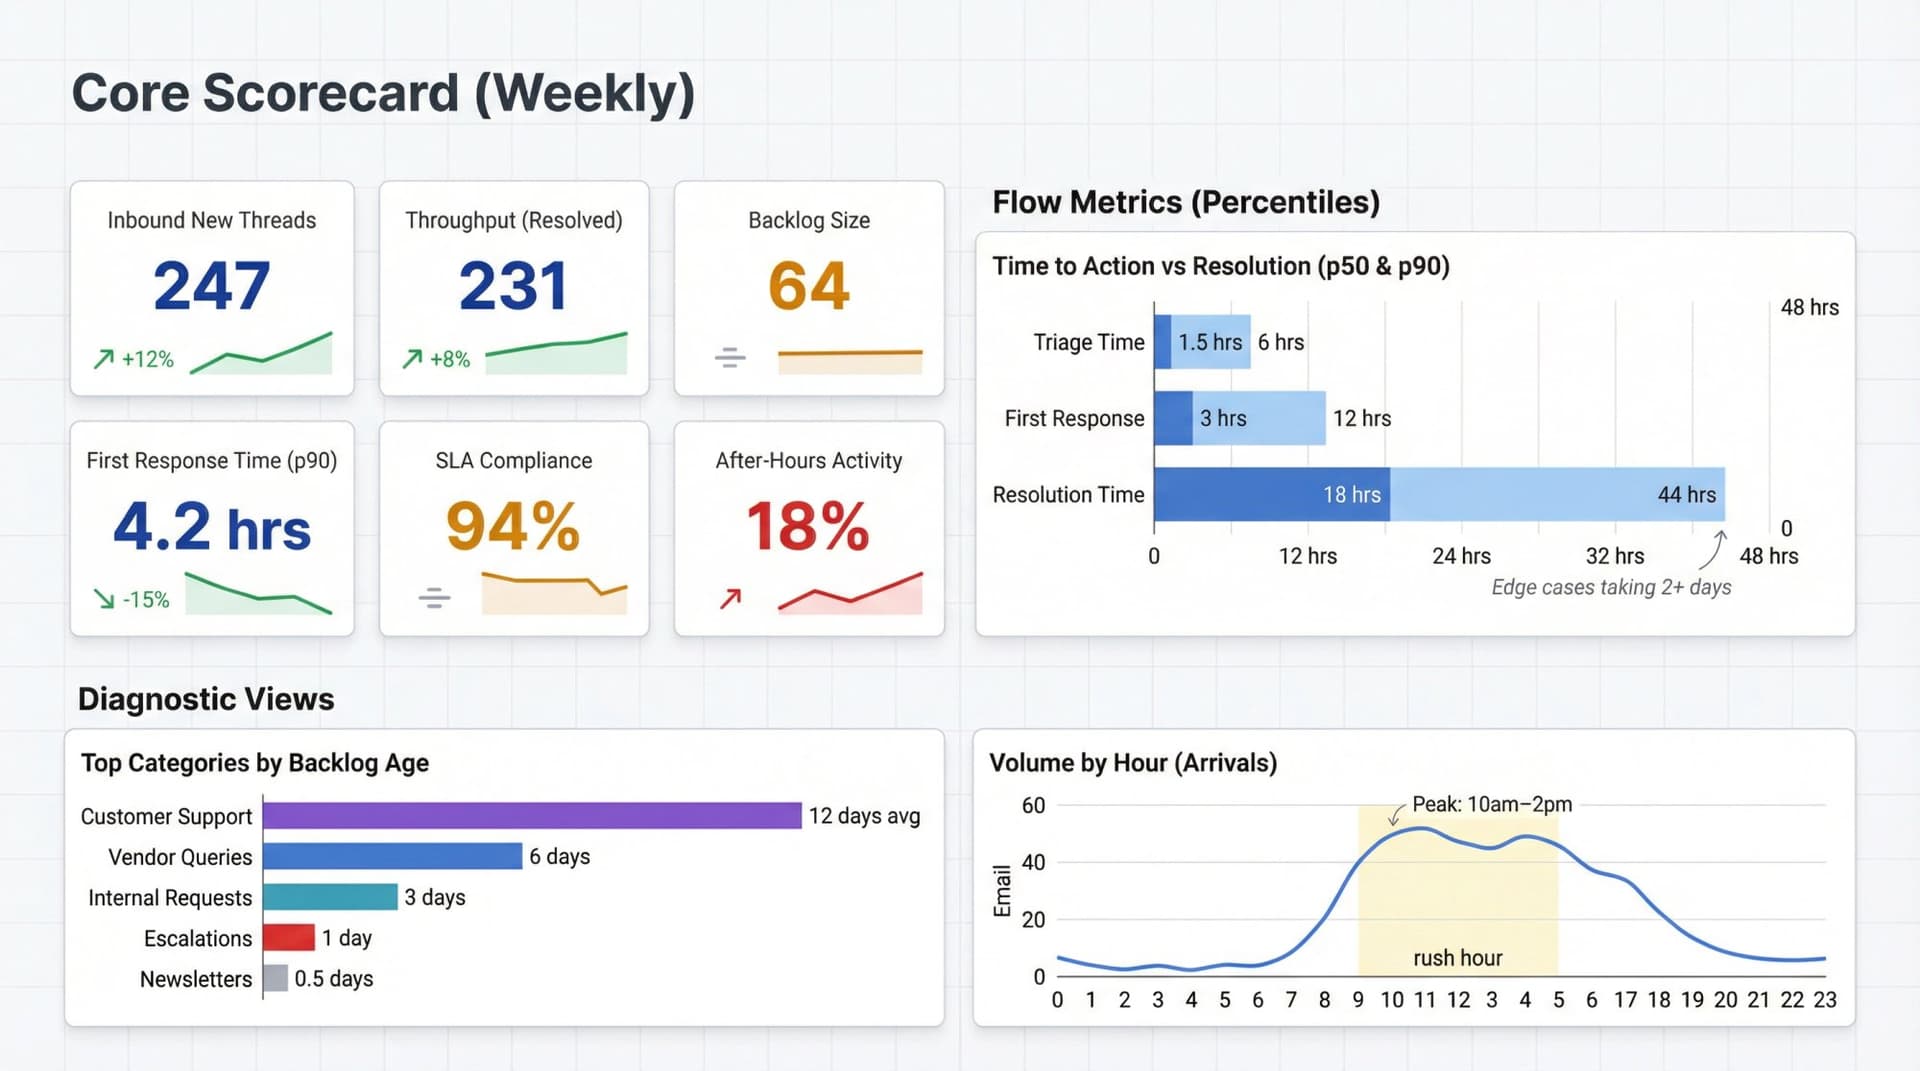
Core Scorecard (Weekly)
Track these every week at the team level:
| Metric | What to Track |
|---|---|
| Inbound new threads | Total plus breakdown by category |
| Throughput | Threads resolved |
| Backlog | Open threads needing action |
| Backlog age | p90 age plus oldest 10 threads |
| First response time | p50 and p90 (business hours only) |
| Resolution time | p50 and p90 |
| SLA compliance | Percentage met for P0/P1/P2 |
| Reopen rate | Percentage reopened within 7 days |
| After-hours activity | Percentage of outbound sent after hours |
| Top drivers | Top categories/senders by volume and backlog age |
Diagnostic Views (When Things Go Wrong)
Use these to troubleshoot performance issues:
→ Time to triage trend
→ SLA compliance by category (what type is failing?)
→ Volume by sender/domain (who creates chaos?)
→ Load by hour (when staffing doesn't match arrivals)
→ Handoff patterns (too much forwarding = unclear ownership)
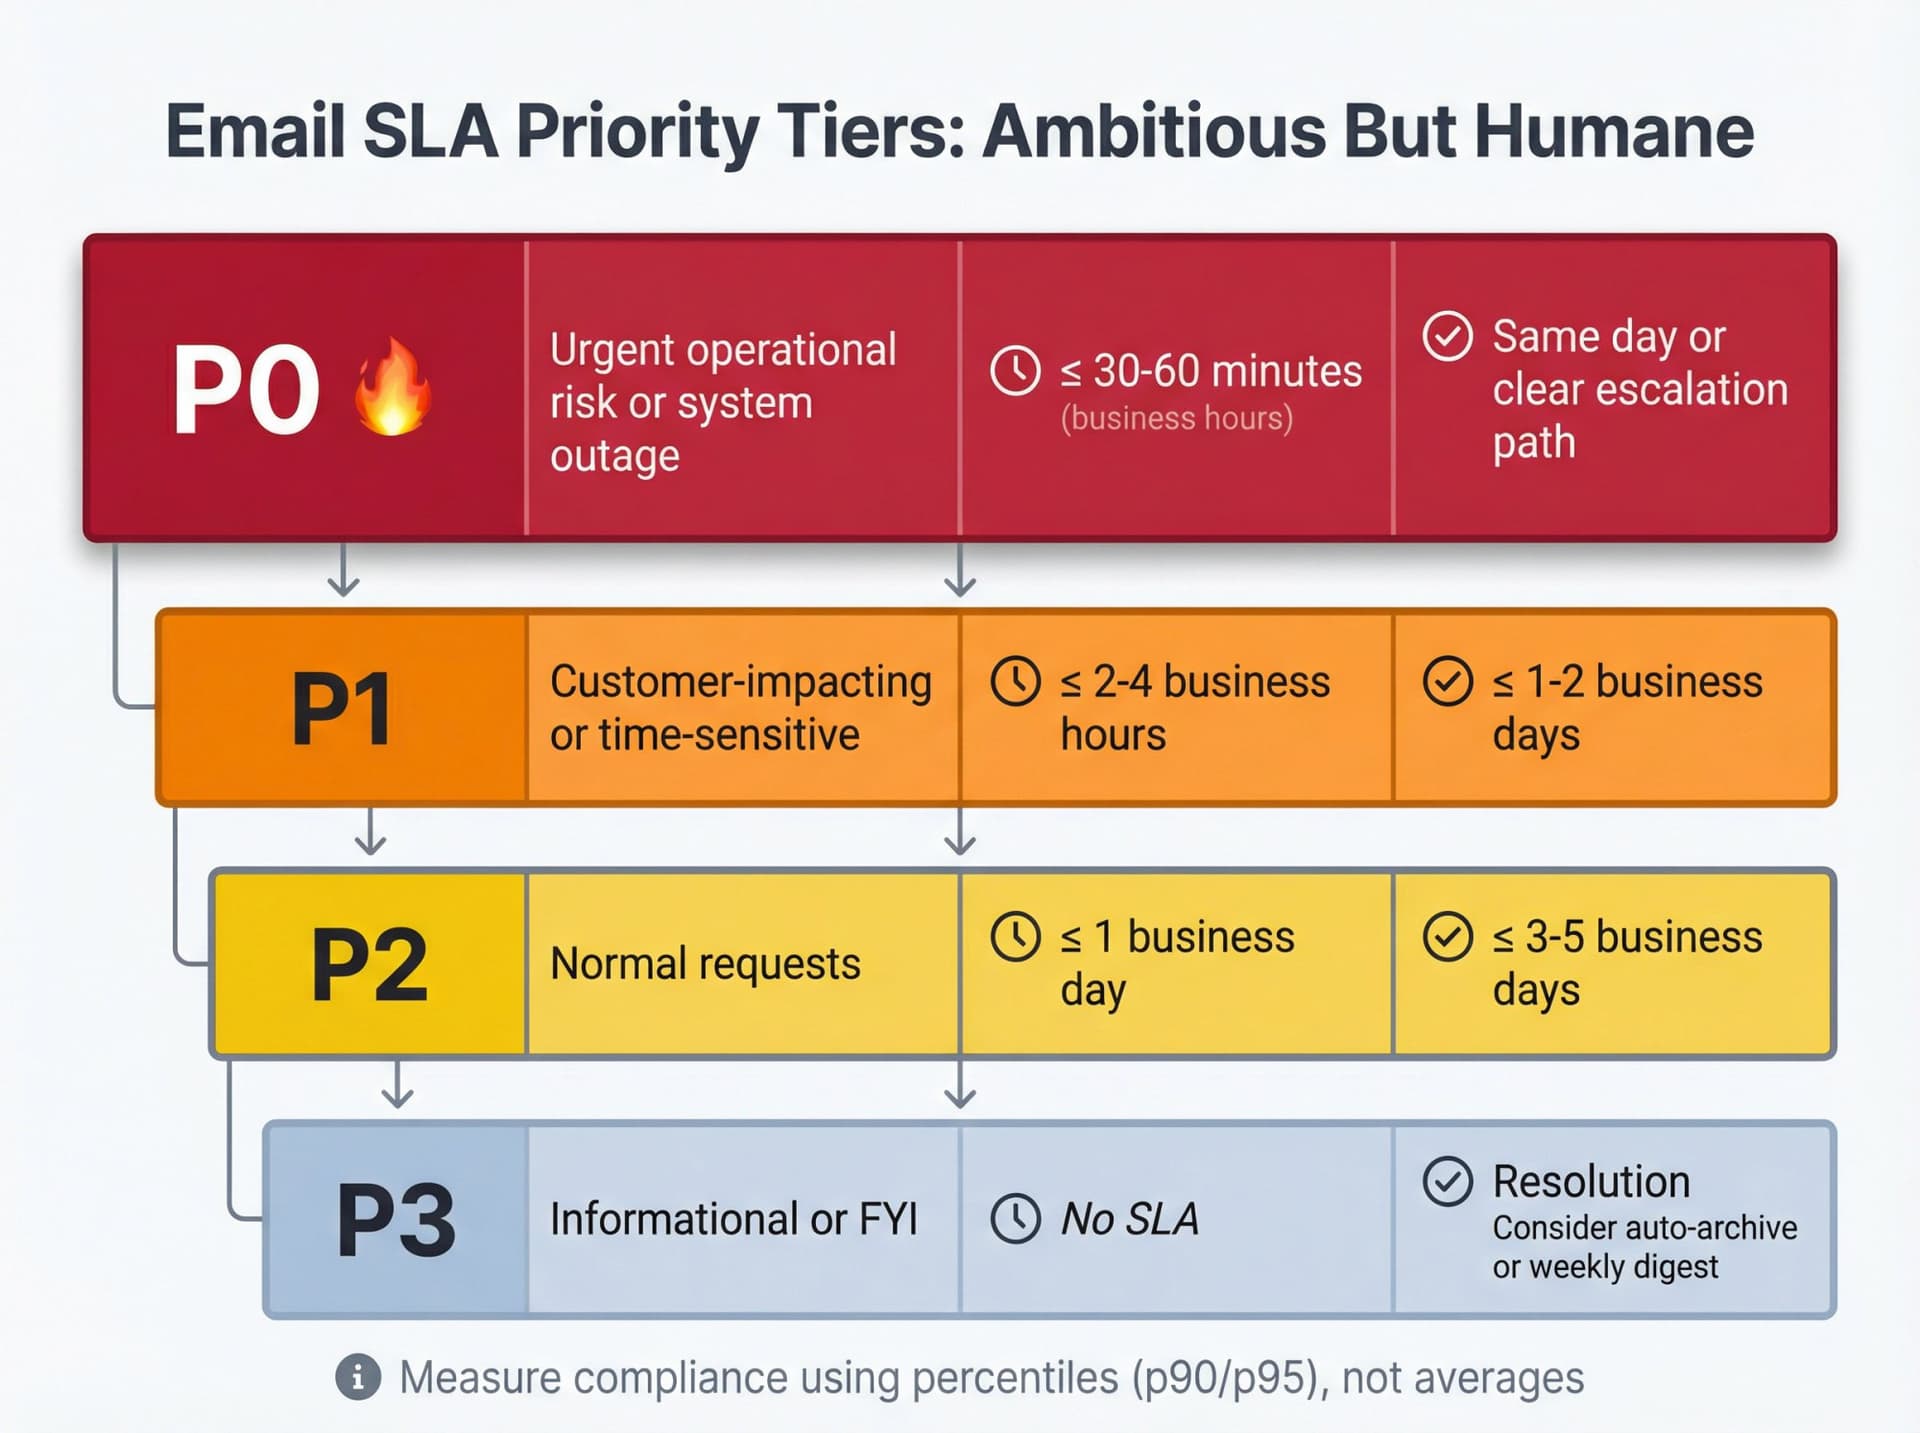
Setting Team SLAs That Are Ambitious But Humane
There's no universal "acceptable response time." The right SLA depends on stakes, alternatives, customer expectations, and your actual capacity.
A modern approach uses priority tiers with different objectives for each.
A Sane Starting Point (Customize for Your Context)
| Priority | Type | First Response | Resolution |
|---|---|---|---|
| P0 | Urgent operational risk or system outage | ≤ 30-60 minutes (business hours) | Same day or clear escalation path |
| P1 | Customer-impacting or time-sensitive | ≤ 2-4 business hours | ≤ 1-2 business days |
| P2 | Normal requests | ≤ 1 business day | ≤ 3-5 business days |
| P3 | Informational or FYI | No SLA | Consider auto-archive or weekly digest |
If you go this route, measure compliance using percentiles, not averages. "95% of P1 emails get first response within 4 hours" is a meaningful commitment.
Measuring Without Creating a Surveillance Culture
Email metrics can become toxic fast if used to rank individuals or punish "slow" people. Don't do that.
Instead: measure the system, not the person.
Privacy-First Best Practices
Use aggregated reporting wherever possible
Show team-level or department-level metrics. Individual metrics should be visible only to that person and their direct manager, used for coaching and support.
Enforce minimum group sizes
Microsoft Viva Insights requires at least five people for aggregated insights. Google Workspace Work Insights shows organizational data only for teams of 10+. This prevents identifying individuals.
Avoid content inspection unless necessary
Track metadata (timestamps, participants, labels) first. Only inspect content if you have a clear, communicated reason (like quality assurance).
Be transparent
Publish metric definitions. Explain why you're measuring and how you'll use the data. Share what changes you plan to make based on findings.
Use metrics to fix process and workload, not to shame people
If someone's response time is slow, ask "what's blocking you?" not "why are you so slow?" Maybe they're overloaded. Maybe they lack training. Maybe the emails they handle are uniquely complex.
Transparency builds trust. Secrecy builds fear.
How to Use These Metrics in the Real World
Three practical paths, depending on your setup.
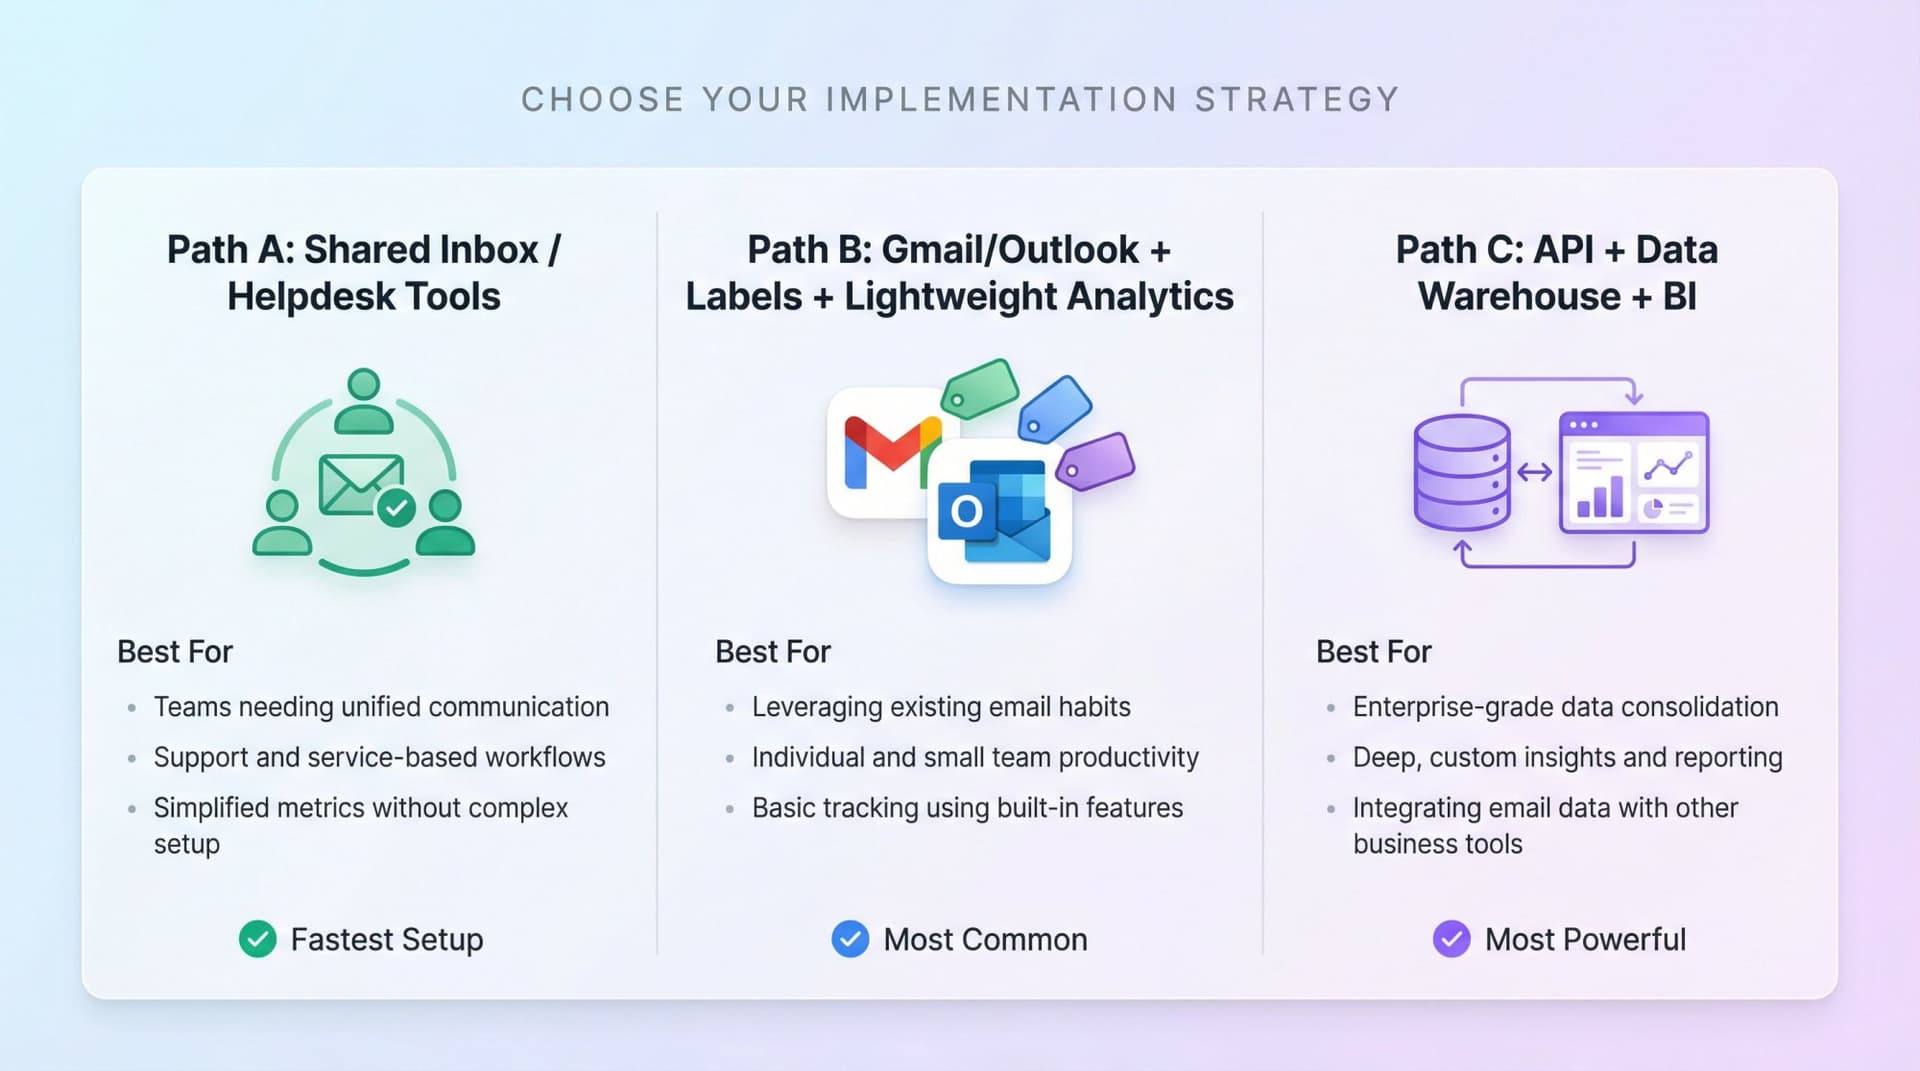
Path A: Shared Inbox / Helpdesk Tools (Fastest)
If you run customer support or an info@/support@ shared inbox with multiple agents, consider helpdesk software that tracks metrics automatically.
Many helpdesk tools explicitly track response time, resolution time, replies to resolve, and handle time out of the box.
Best for:
→ Multiple agents working from the same mailbox
→ Customer-facing teams needing SLA tracking
→ Teams that need assignment and collision prevention
Path B: Gmail/Outlook + Labels + Lightweight Analytics (Most Common)
If your team works from individual inboxes, you can still measure flow by standardizing "states" using labels (Gmail) or categories (Outlook).
Suggested state model:
| State | Meaning |
|---|---|
| Needs Triage | Just arrived, not yet categorized |
| To Reply | Needs outbound response |
| Awaiting Reply | Waiting on someone else |
| In Progress | Owned but not yet resolved |
| Done | Archived/closed |
Then measure:
→ Backlog by counting "To Reply"
→ Backlog age by oldest timestamp in "To Reply"
→ Flow by transitions between states
Tools like Inbox Zero can help here. Its Reply Zero feature automatically labels threads that need responses and tracks what you're waiting on. The Email Analytics module shows volume, top senders, response patterns, and category breakdowns without requiring a data team.
Path C: API + Data Warehouse + BI (Most Powerful, Most Work)
For larger organizations with data teams, extract metadata (not content) via Gmail API or Microsoft Graph:
→ Inbound timestamp
→ Outbound reply timestamp
→ Labels/categories
→ Participants (hashed for privacy)
→ Thread ID
Then compute your full metric dictionary with complete control and custom analysis.
Best for:
→ Enterprise teams with existing data infrastructure
→ Organizations with strict compliance requirements
→ Teams that need deeply customized reporting
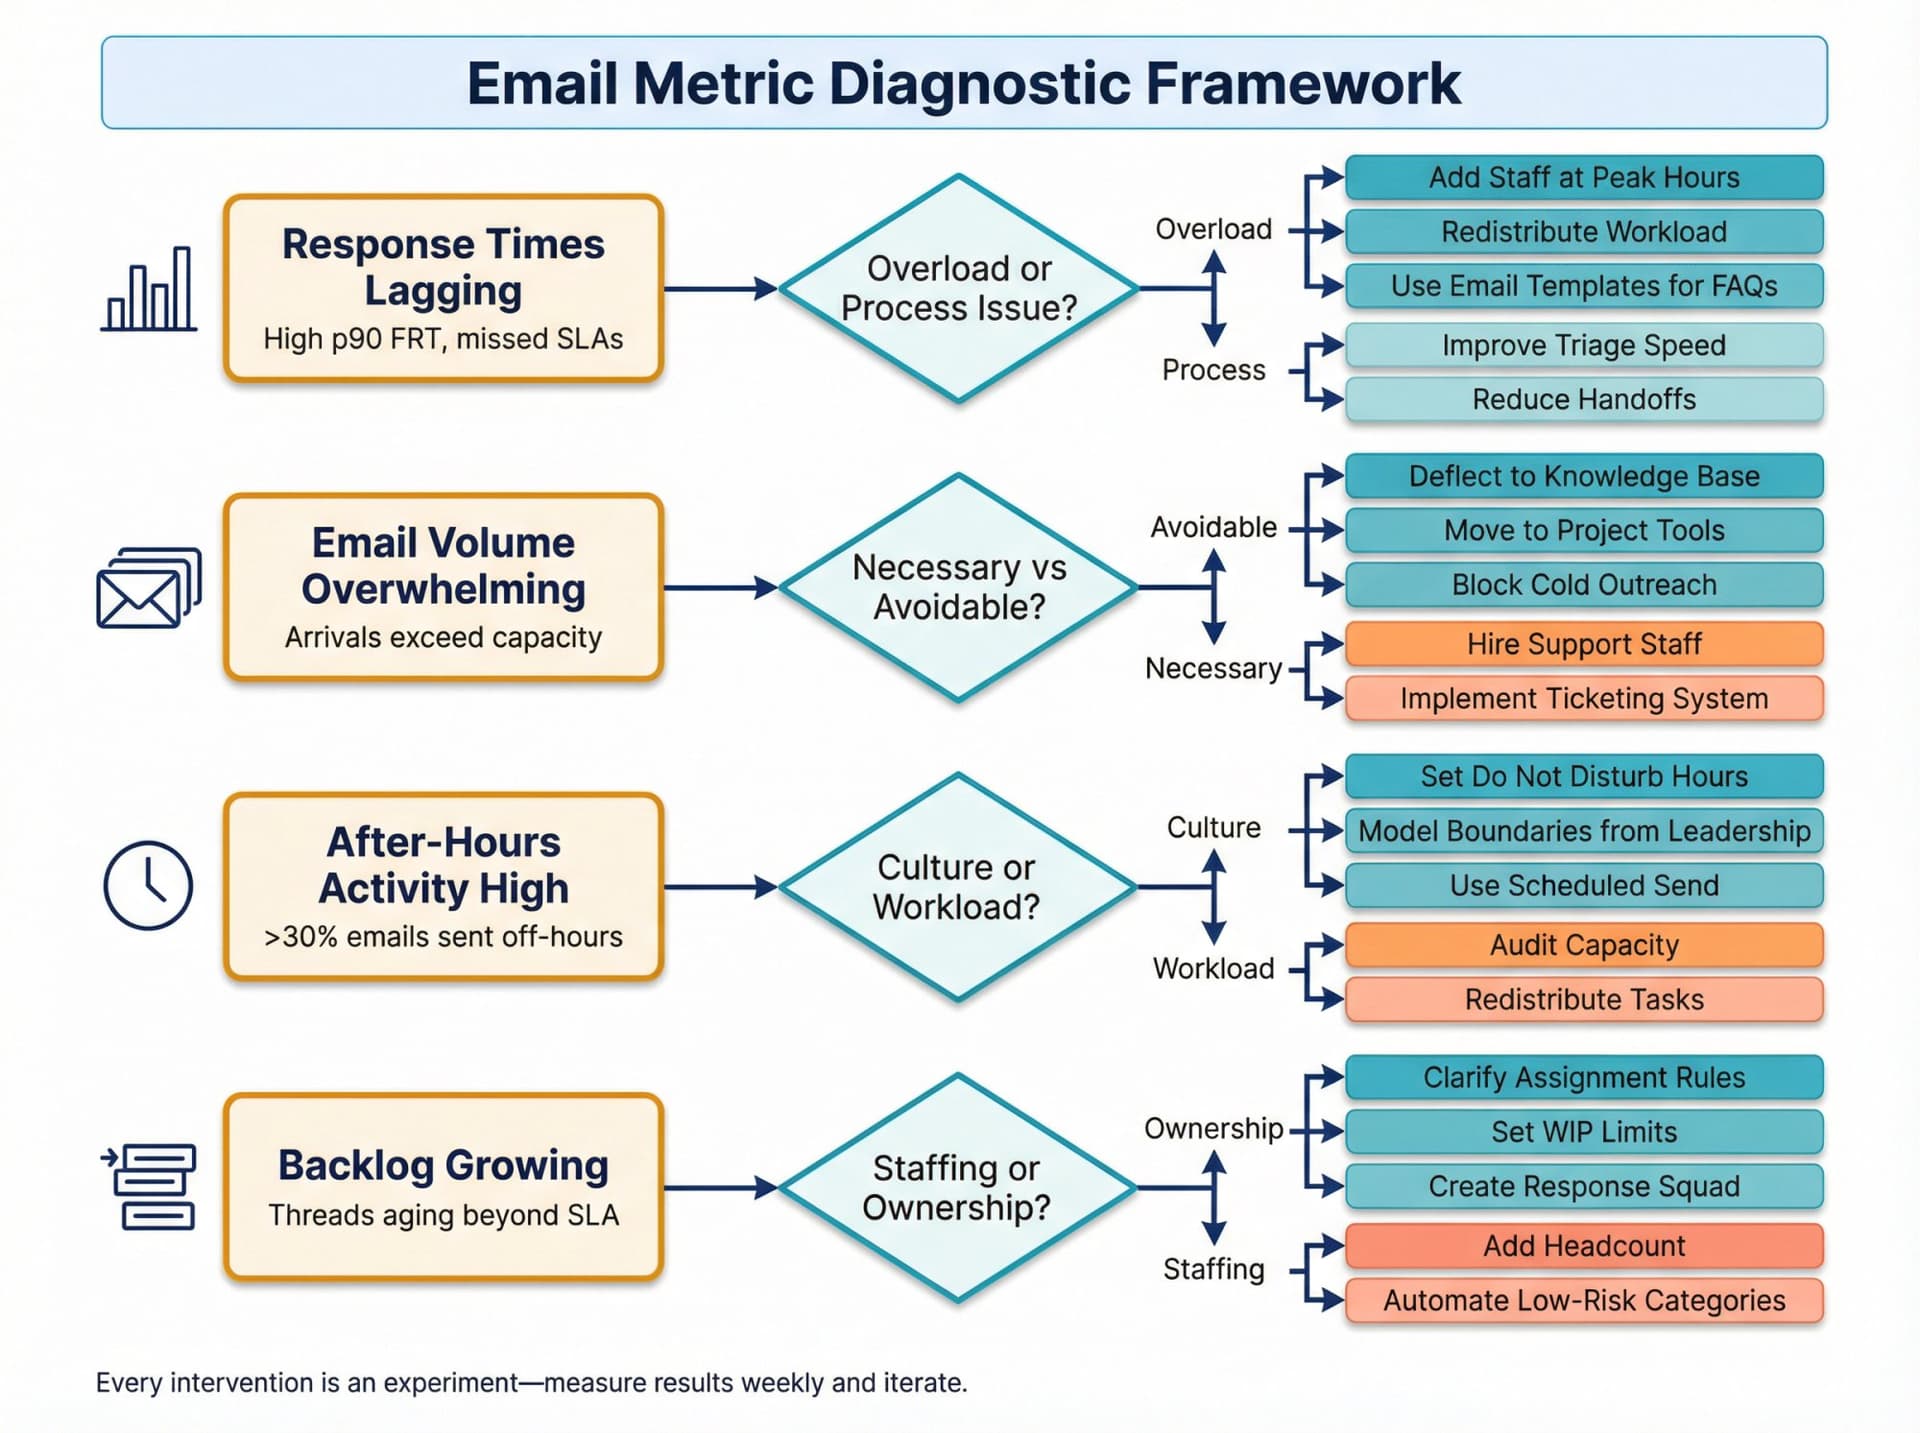
Turning Metrics Into Action
Having data is worthless without action. Here's how to use insights to drive real improvements.
① Establish Clear Baselines and Goals
Once you have data, interpret it in context. What's "good" for one team might be "poor" for another.
Set baseline measurements: "Last quarter, our team's average response time was 8 hours, and we sent 250 emails per week per person."
Then set improvement targets: "We aim to cut customer response time to 4 hours and reduce after-hours emails by 30%."
② Share Metrics With the Team
Transparency drives ownership. Create a simple dashboard or report that everyone can see, highlighting key metrics and progress.
When team members see the data, they naturally take ownership. If you openly track "90% of customer emails answered within 1 business day" and set a goal to reach 100%, the team will collectively strive for that last 10%.
③ Turn Insights Into Concrete Actions
For each out-of-line metric, discuss why and brainstorm solutions:
If response times are lagging:
Try email templates for FAQs. Redistribute workload. Add staff during peak hours.
If email volume is overwhelming:
Look at root causes. Can some communication move to project management tools or chat? Can you deflect common questions to a knowledge base?
If after-hours emails are high:
Set expectations around off-hours communication. Encourage scheduled send. Establish Do Not Disturb hours. Model healthy boundaries from leadership.
If unanswered emails are piling up:
Create a "response squad" or rotating duty where one person daily checks for inquiries older than X hours.
If thread lengths are excessive:
Train the team on writing clearer emails. Establish the "5-reply rule" (beyond 5 replies, move to a call).
Every action is an experiment. Use the metrics in a continuous feedback loop. Did the "email-free Friday afternoon" policy actually reduce Friday volume? Check the data next week. If yes, great. If no, maybe the policy wasn't fully adopted or needs adjustment.
④ Use Automation and AI
Sometimes the fix isn't changing human behavior; it's smarter technology.
Examples:
→ Set up filters or AI to auto-archive newsletters, receipts, and bulk email
→ Use AI email assistants (like Inbox Zero's AI Personal Assistant) to draft replies for routine emails or categorize by priority
→ Enable push notifications or Slack integrations for high-priority senders
→ Use follow-up reminders for threads awaiting reply
⑤ Make Email Metrics a Regular Discussion
Review metrics in team meetings or one-on-ones. This shouldn't feel punitive ("big brother watching"). It should feel like normal process optimization.
The goal isn't to turn people into robots who live for the dashboard. It's to free people from email overload so they can focus on meaningful work.
The 30-Day Rollout Plan
A safe way to introduce metrics and automation without breaking trust.
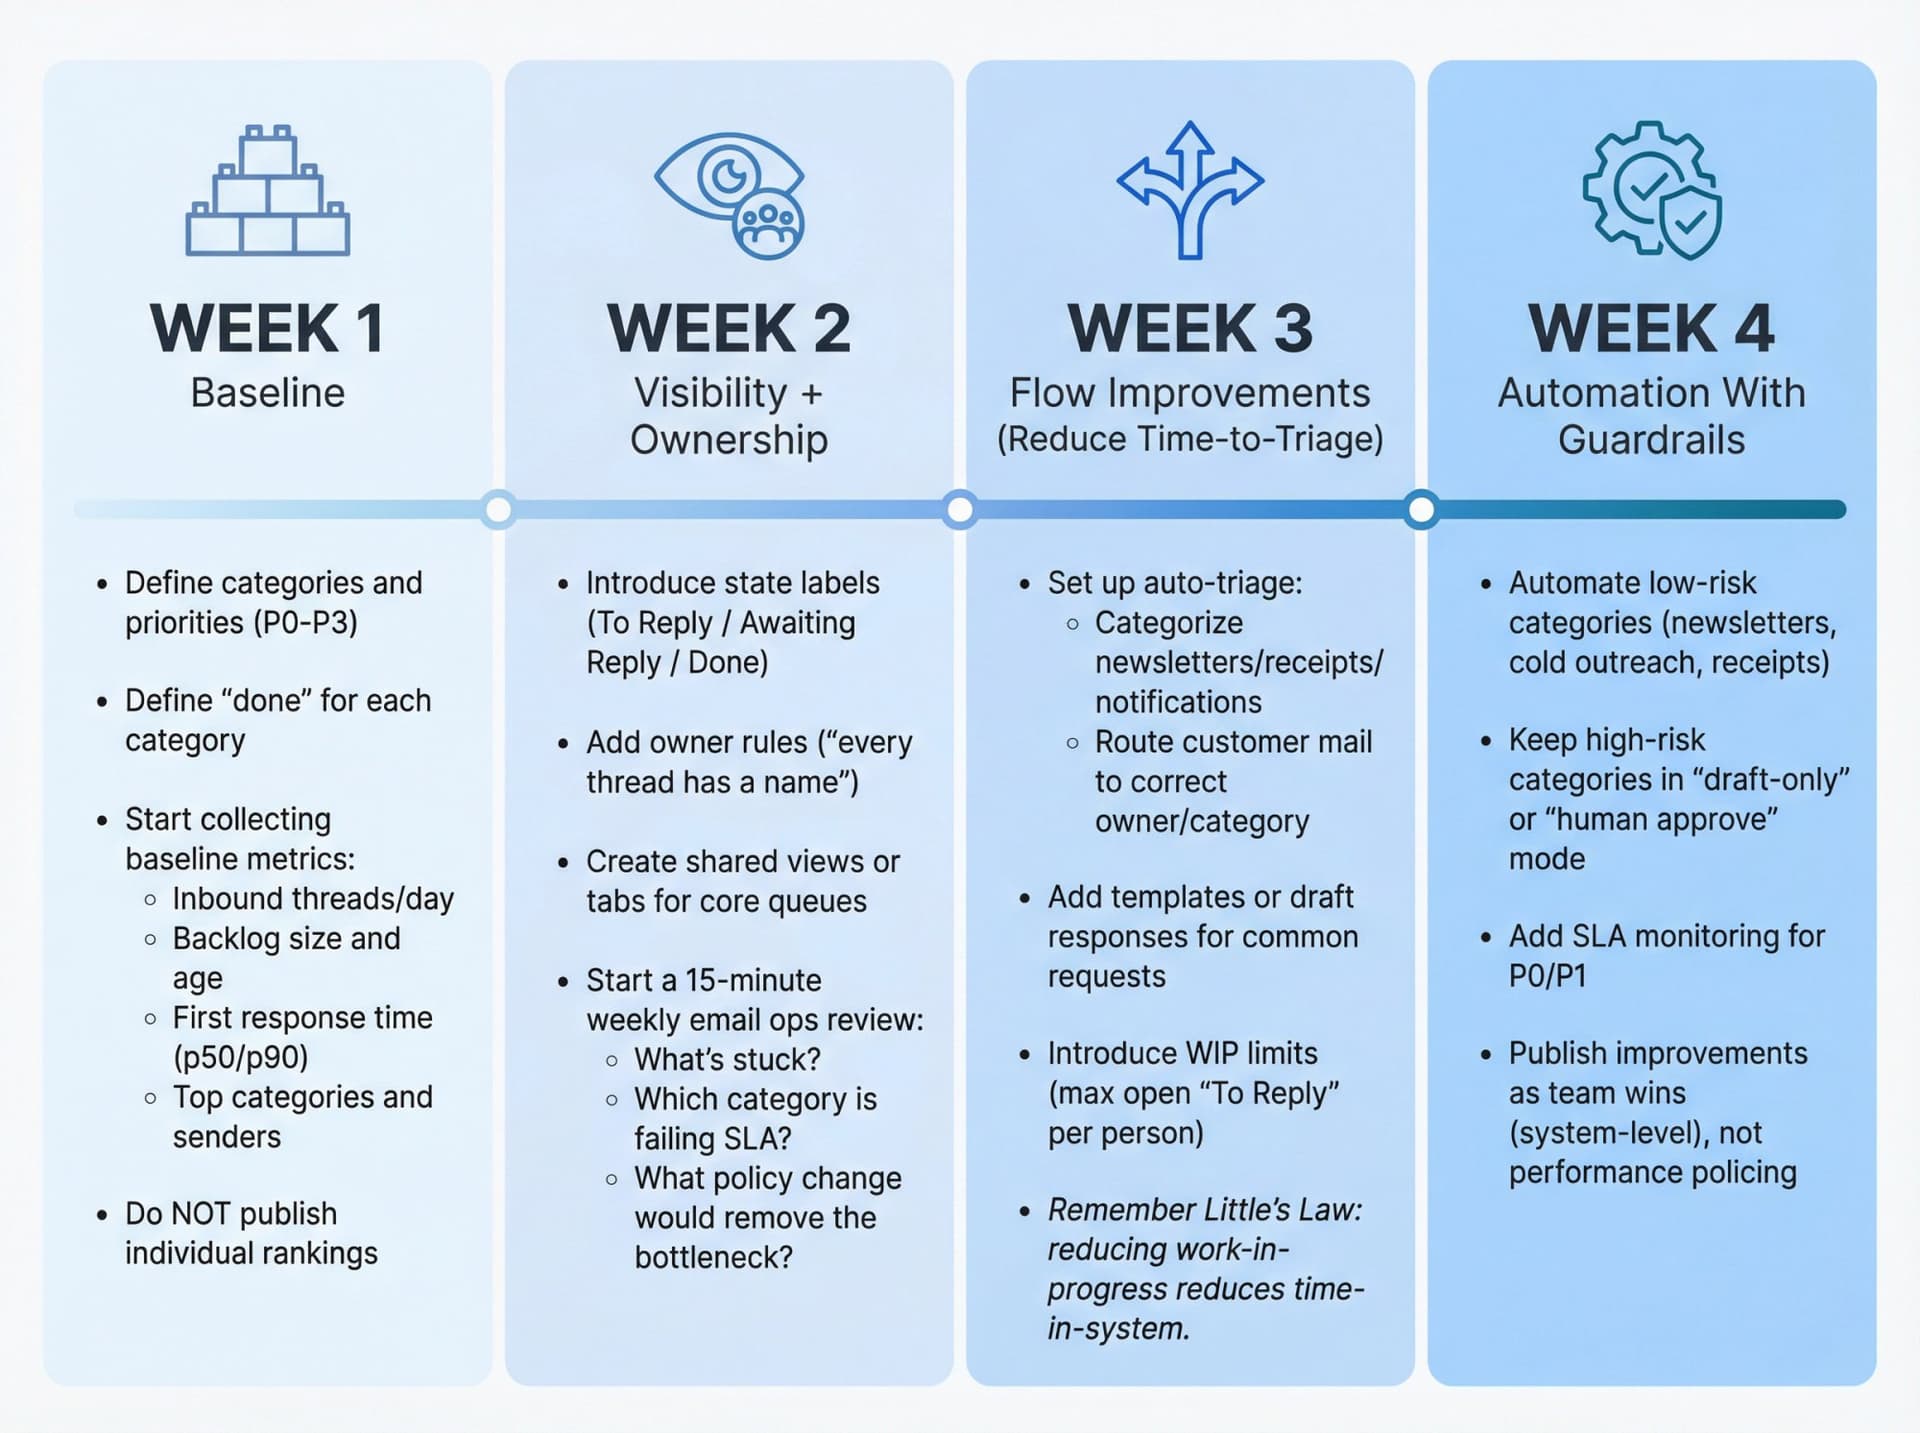
Week 1: Baseline (No Behavior Change Yet)
→ Define categories and priorities (P0-P3)
→ Define "done" for each category
→ Start collecting baseline metrics:
-
Inbound threads/day
-
Backlog size and age
-
First response time (p50/p90)
-
Top categories and senders
→ Do NOT publish individual rankings
Week 2: Visibility + Ownership
→ Introduce state labels (To Reply / Awaiting Reply / Done)
→ Add owner rules ("every thread has a name")
→ Create shared views or tabs for core queues
→ Start a 15-minute weekly email ops review:
-
What's stuck?
-
Which category is failing SLA?
-
What policy change would remove the bottleneck?
Week 3: Flow Improvements (Reduce Time-to-Triage)
→ Set up auto-triage:
-
Categorize newsletters/receipts/notifications
-
Route customer mail to correct owner/category
→ Add templates or draft responses for common requests
→ Introduce WIP limits (max open "To Reply" per person)
Remember Little's Law: reducing work-in-progress reduces time-in-system.
Week 4: Automation With Guardrails
→ Automate low-risk categories (newsletters, cold outreach, receipts)
→ Keep high-risk categories in "draft-only" or "human approve" mode
→ Add SLA monitoring for P0/P1
→ Publish improvements as team wins (system-level), not performance policing
What Exceptional Teams Do Differently
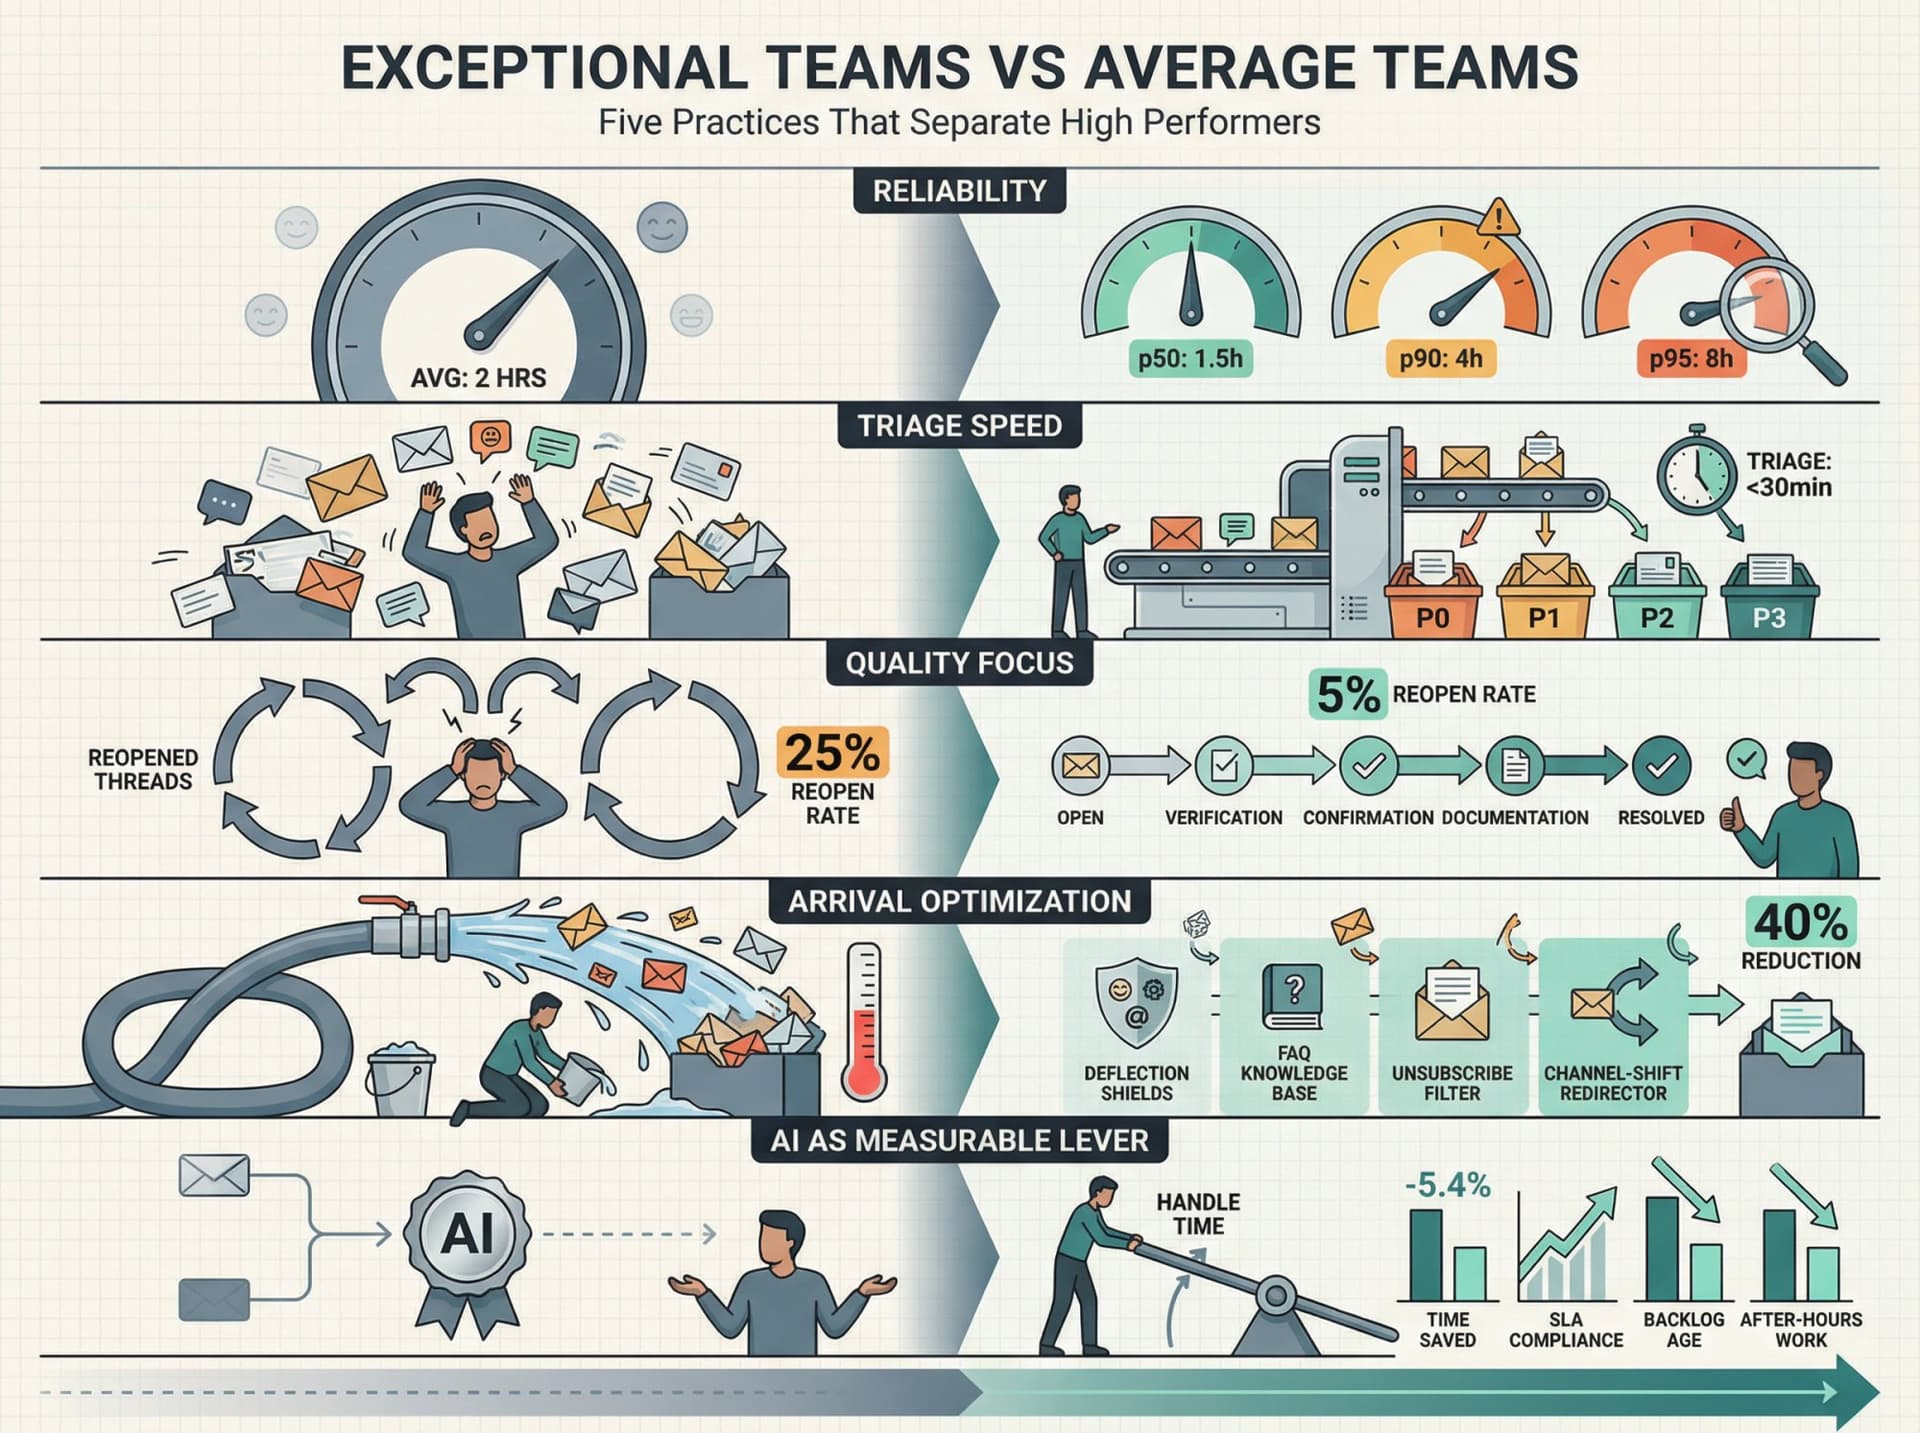
① They Separate "Speed" From "Reliability"
They don't celebrate "average response time." They measure p90/p95 response times, oldest backlog items, and SLA compliance by priority.
This prevents "we're usually fast" complacency.
② They Obsess Over Triage, Not Just Replies
Most teams focus on replying faster. Elite teams focus on triage speed and ownership clarity, because triage determines everything downstream.
If it takes six hours to figure out who owns an email, you've already lost the day.
③ They Track Rework, Not Just Closure
Reopens, escalations, and excessive back-and-forth are the real cost drivers. Closing a thread that comes back two days later is worse than leaving it open longer to solve it right the first time.
④ They Optimize the Arrival Rate, Not Just Processing
The fastest email is the email that never arrives:
→ Deflection (FAQ, self-serve knowledge base)
→ Channel shifting (some requests belong in a ticketing system, not email)
⑤ They Treat AI as a Measurable Operations Lever
AI can produce real time savings, but you should prove it with metrics. A 2026 Federal Reserve Bank of St. Louis analysis found generative AI users reported average time savings of 5.4% of work hours (about 2.2 hours per week for a 40-hour worker).
Connect AI usage to:
→ Reduced handle time
→ Improved SLA compliance
→ Reduced backlog age
→ Reduced after-hours work
If the metrics don't move, your "AI rollout" is just novelty.
Common Mistakes That Destroy Email Metrics Programs
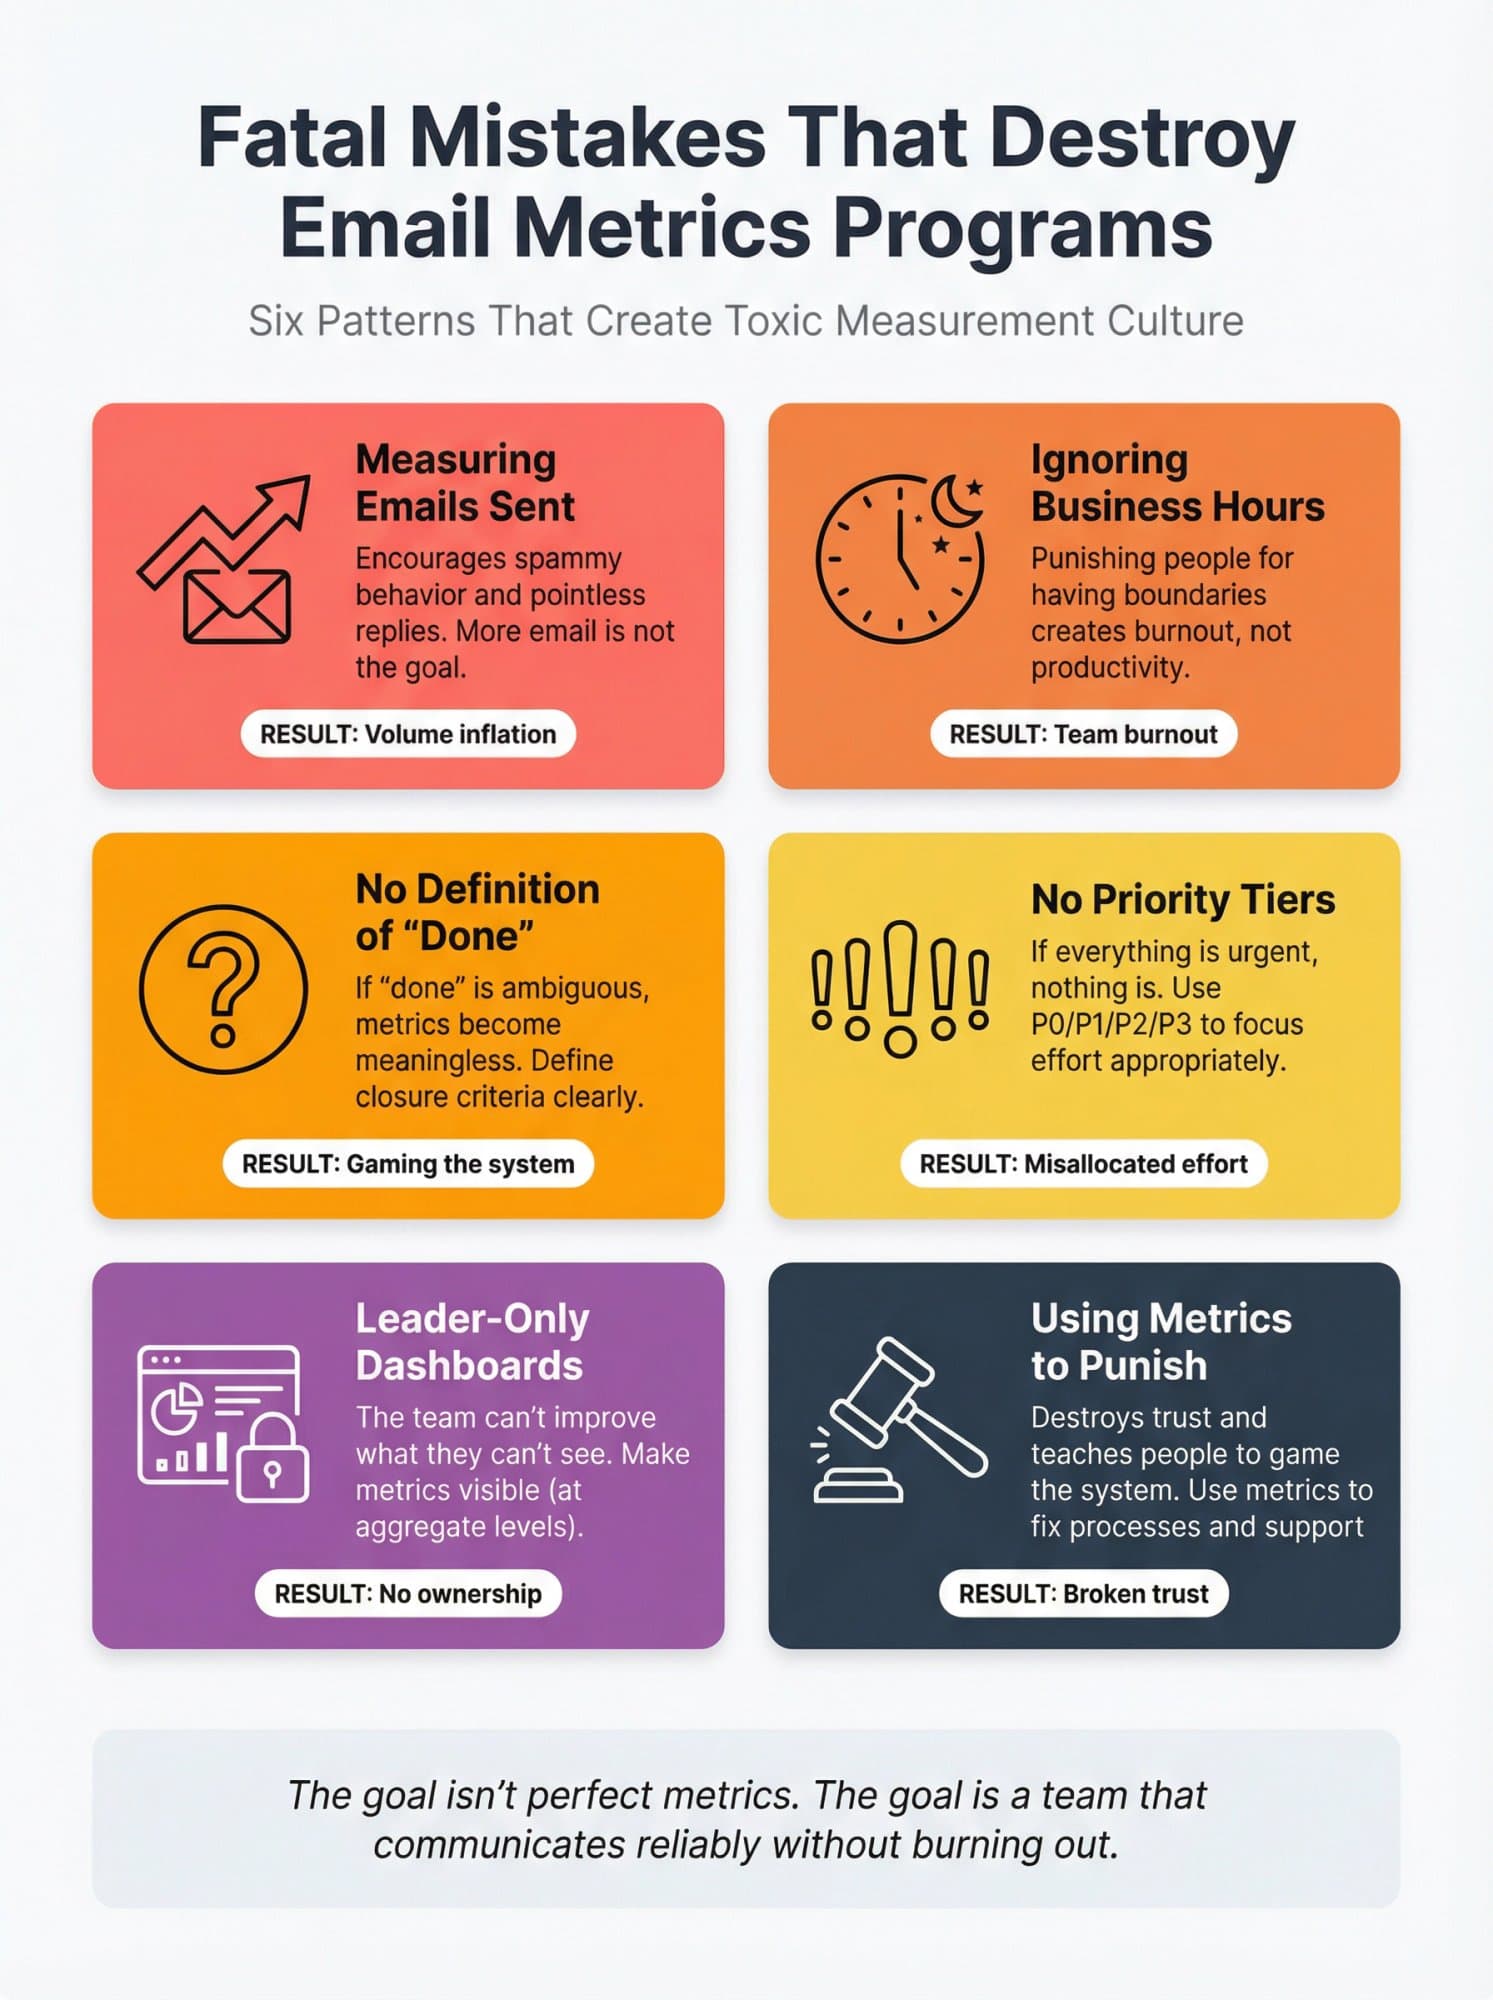
Measuring emails sent
This encourages spammy behavior and pointless replies. More email is not the goal.
Ignoring business hours
Punishing people for having boundaries creates burnout, not productivity.
No definition of "done"
If "done" is ambiguous, metrics become meaningless. Define closure criteria clearly.
No priority tiers
If everything is urgent, nothing is. Use P0/P1/P2/P3 to focus effort appropriately.
Leader-only dashboards
The team can't improve what they can't see. Make metrics visible (at aggregate levels).
Using metrics to punish
This destroys trust and teaches people to game the system. Use metrics to fix processes and support people.
How Inbox Zero Fits Into a Team Metrics System
Full disclosure: we built Inbox Zero to solve exactly this problem. Here's how it helps if you want to operationalize faster.
Our philosophy is per-message understanding → deterministic execution → human control. You get structure and automation without losing oversight.
Reply Zero Gives You Work State Labels
Reply Zero automatically labels threads so you know what needs a response and what you're waiting on. It creates two measurable queues:
→ To Reply backlog (threads needing your outbound response)
→ Awaiting Reply backlog (threads where you're waiting on others)
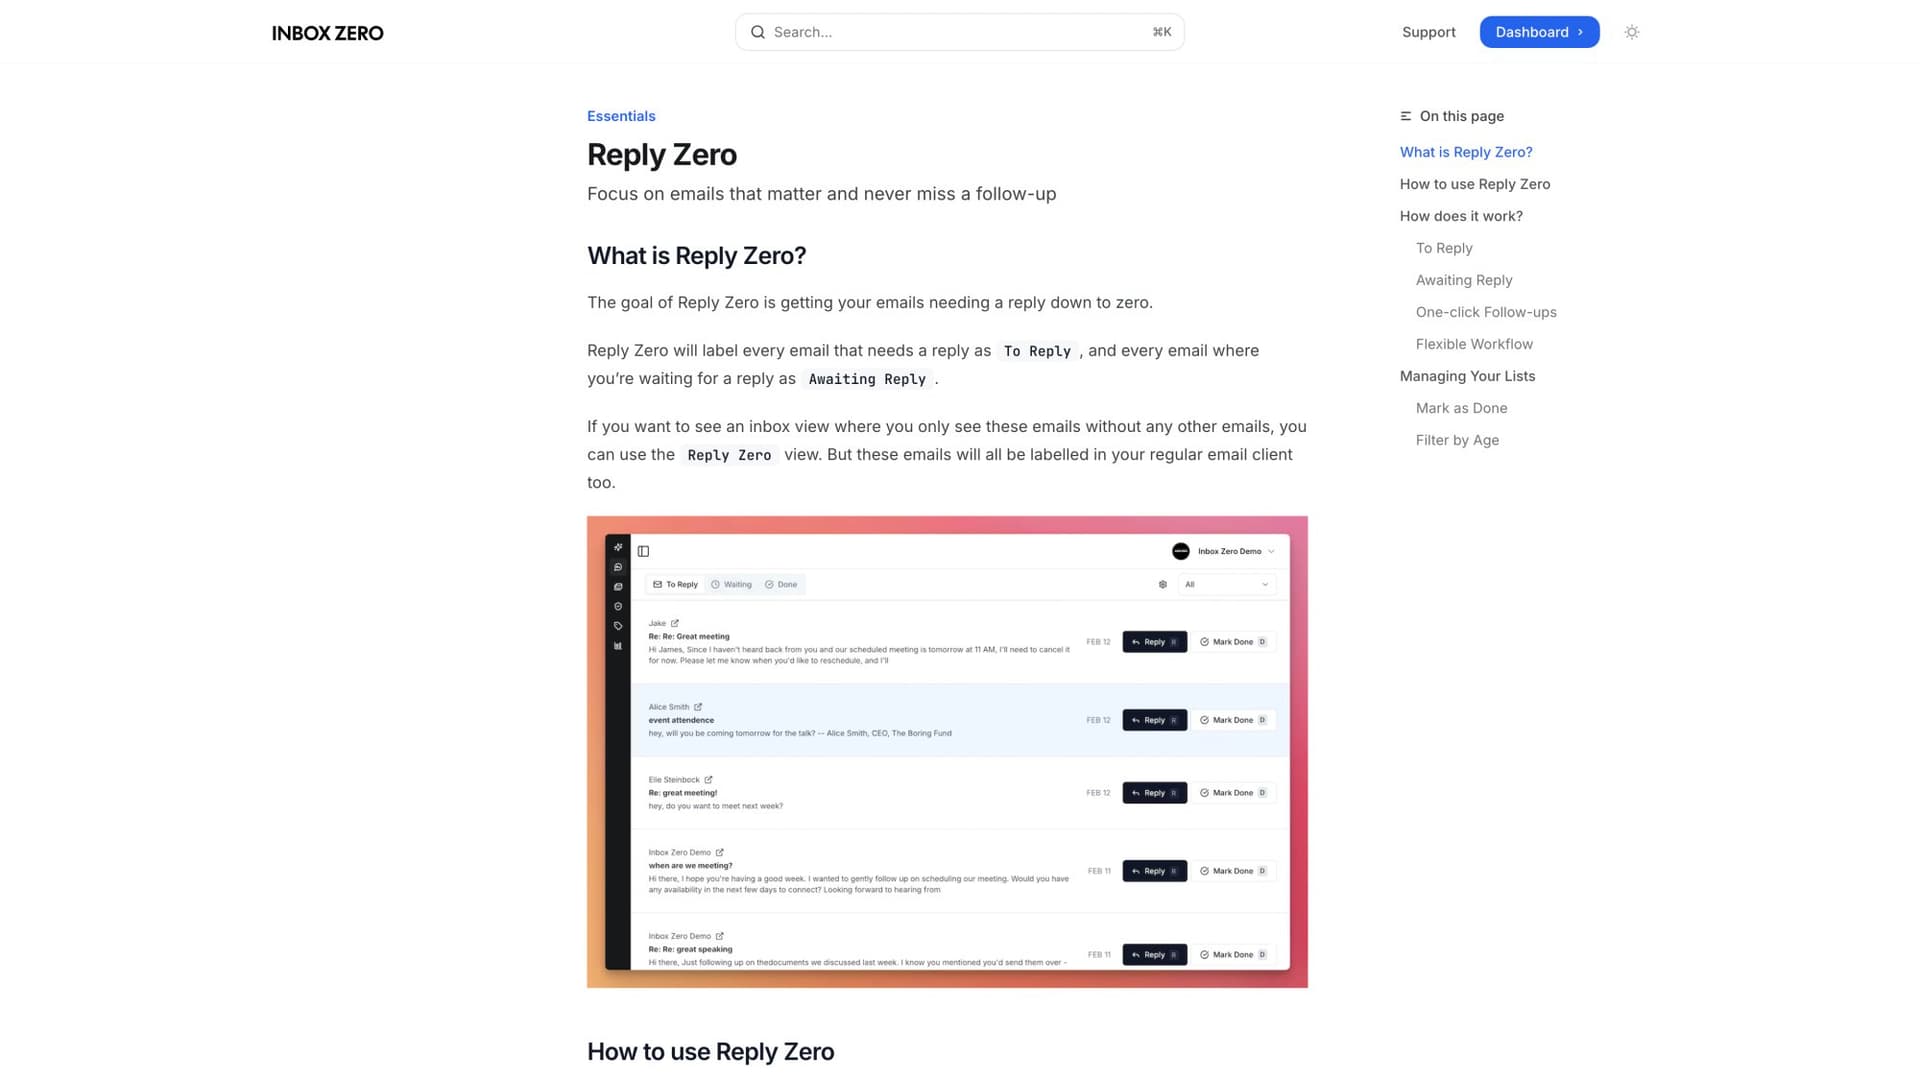
This turns "inbox anxiety" into concrete, trackable queues you can manage.
Learn more in our Reply Zero documentation.
Email Analytics Quantifies Volume and Patterns
Our Email Analytics module shows:
→ Who emails you most
→ Response time patterns
→ Category breakdowns
→ Volume trends
This supports your dashboard layer (load + flow) without requiring a custom BI stack.
Inbox Zero Tabs for Gmail Makes Your System Visible Daily
Our Chrome extension adds customizable tabs inside Gmail so teams work from consistent views (split inbox style). It's 100% private with all data staying in your browser.
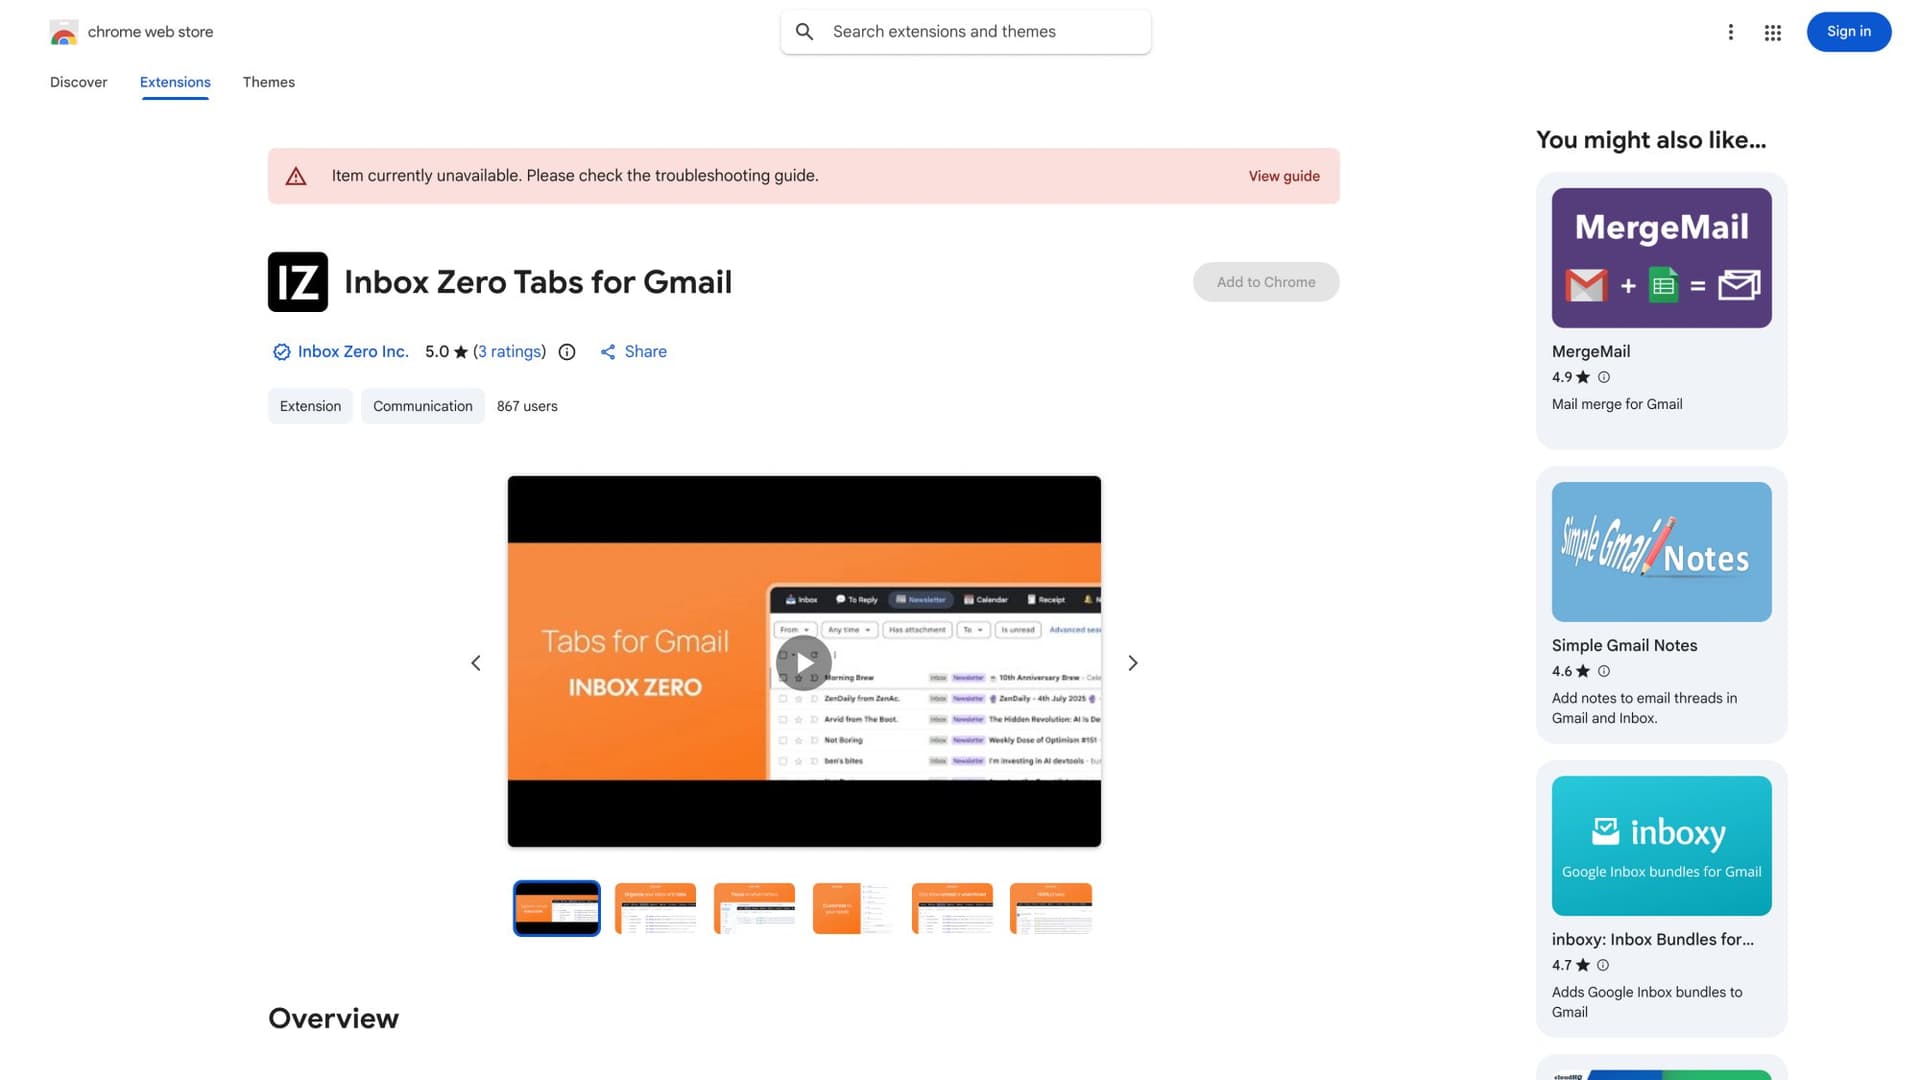
This matters for metrics because you can create tabs that map directly to measured queues:
→ "To Reply"
→ "Awaiting Reply"
→ "P0/P1"
→ "Customer Escalations"
Example tabs you can standardize:
label:"To Reply" is:unread
label:"Awaiting Reply" older_than:7d
from:@bigcustomer.com label:"To Reply"
larger:10M has:attachment
Learn more about the Inbox Zero Tabs extension.
AI Personal Assistant Module
Our AI Personal Assistant helps with:
→ Auto-labeling and categorization (reduces triage time)
→ Draft replies for routine emails (reduces handle time)
→ Smart filtering of newsletters and cold outreach (reduces arrival volume)
→ Bulk unsubscribe (reduces noise)
All of this directly impacts the metrics we've discussed: faster triage, faster response, smaller backlog, less after-hours work.
Security Posture
If you're measuring and automating email at scale, security isn't optional. Inbox Zero is SOC 2 Type 2 compliant with a public trust center showing policies and controls.
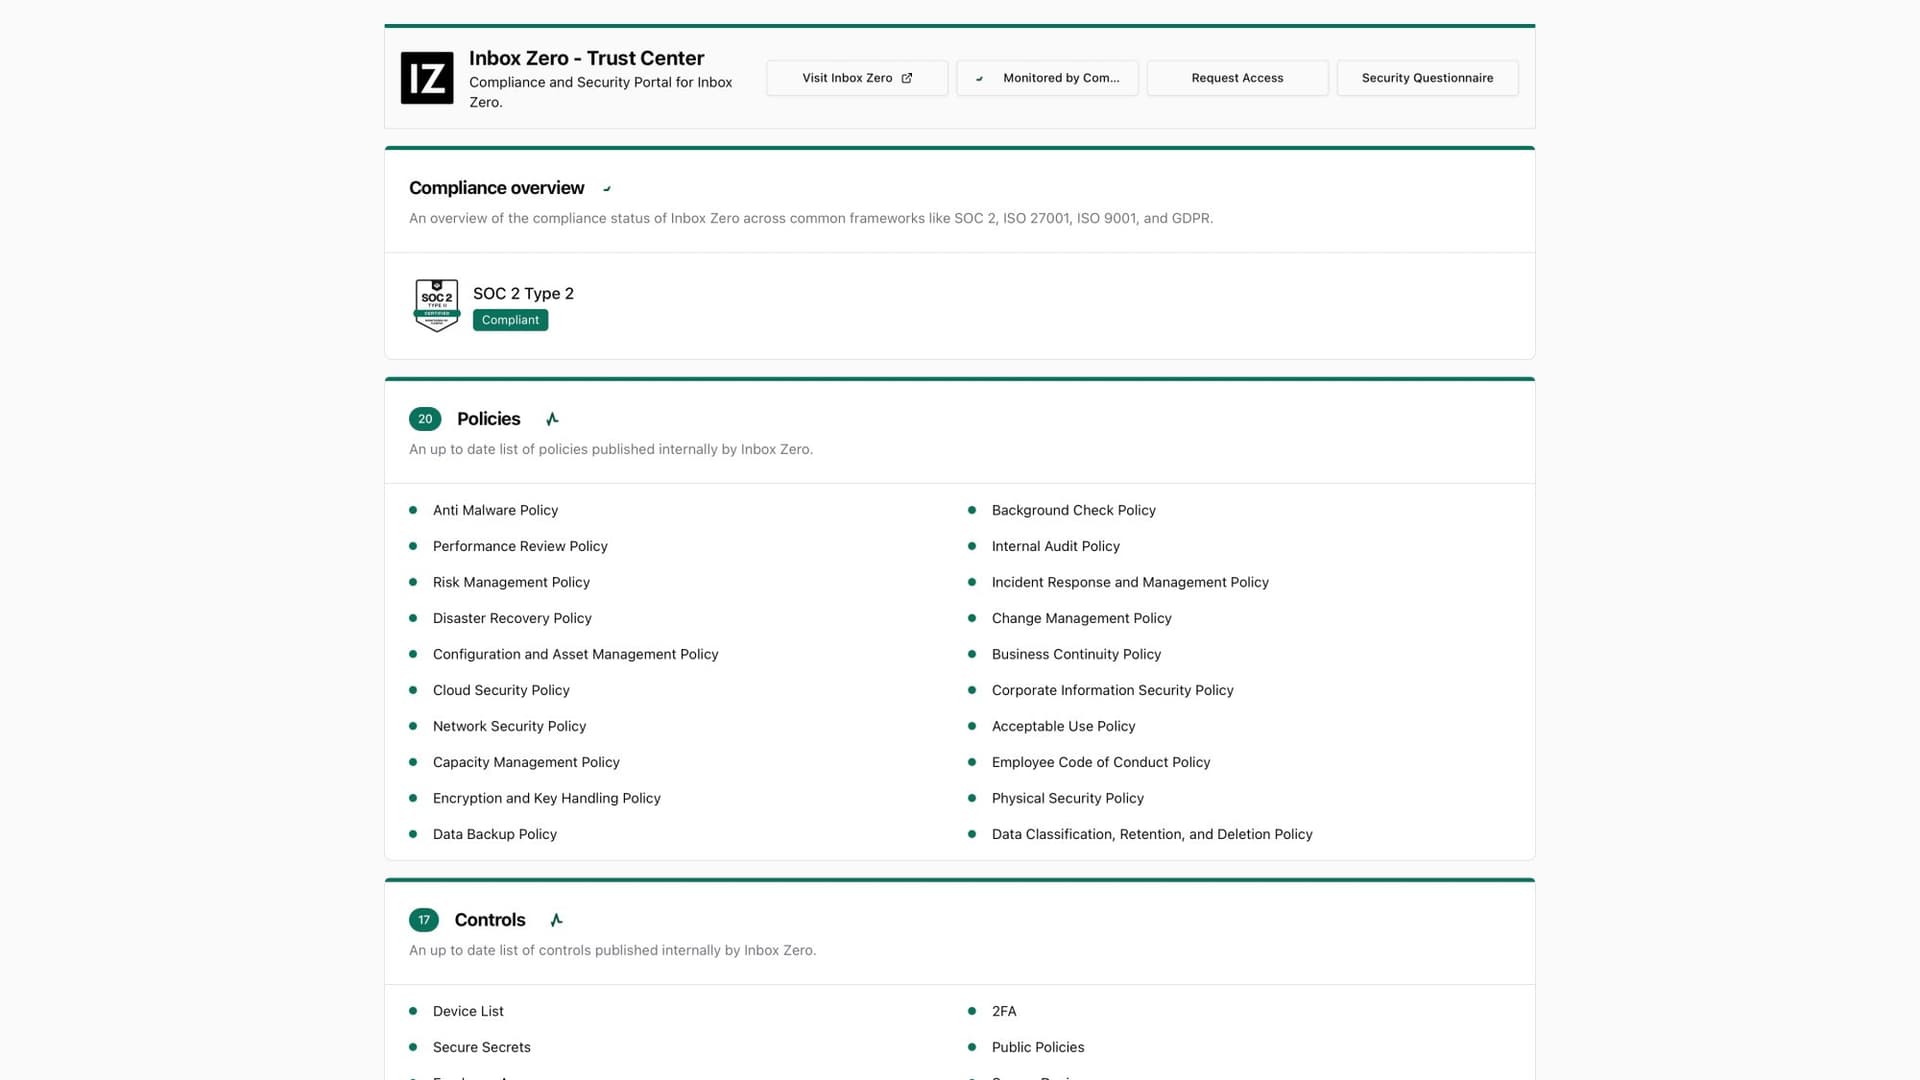
Learn more about our enterprise security features.
The Bottom Line
Teams that measure email productivity properly reclaim significant time. Even a 10% efficiency improvement (saving 30 minutes daily) adds up to over 100 hours per employee per year.
That's time for closing deals, building products, or simply reducing stress.
The first step is measuring where you stand today. Use the metrics in this guide as your roadmap:
Start with load and flow metrics (volume, FRT, backlog)
Add quality metrics when you have baseline flow working (reopens, escalations)
Protect sustainability from day one (after-hours activity, workload distribution)
Measure with privacy (aggregate reporting, transparency, system focus)
Turn data into action (weekly reviews, concrete experiments, continuous improvement)
Remember: the goal isn't perfect metrics. The goal is a team that communicates reliably without burning out. Measure what matters, act on what you learn, and give your team their time back.
Ready to try these metrics for your team? Try Inbox Zero to automatically track email performance, reduce backlog, and save hours every week.

What is the Inbox Zero Method & How do I Master It?
Discover the Inbox Zero method and learn simple steps to take control of your email inbox, stay organized, and boost productivity.

4 Email Productivity Hacks from Tim Ferriss, Andrew Huberman, and Sam Harris
Explore 4 powerful email productivity hacks from tech and wellness experts like Tim Ferriss and Andrew Huberman. Learn to create focus, optimize processing, manage time wisely, and delegate effectively to conquer your inbox.
Best Time to Send Emails for Response (2026)
Stop guessing when to send emails. Get data-backed timing strategies from 2026 research that improve response rates across all scenarios.

How To Organize Outlook Inbox? (2026 Guide)
Learn how to organize Outlook inbox with rules, folders, categories, and AI automation. Step-by-step guide for 2026 that actually works.